

Bigfoot Data We Ignore: Why “Nothing” Could Be the Key to Discovering Sasquatch
Discover why “nothing” might be the key to Bigfoot science — how null data transforms Sasquatch research into real ecology.
What if the secret to finding Bigfoot isn’t new technology, but data about nothing? In this post, I explore the scientific value of null data, the unreported “zeros” from field investigations where no sightings occur. Learn how documenting absences can transform Bigfoot research into a true ecological science using presence-absence data, occupancy models, and detection probabilities.
Video Transcript
The Power of Nothing: Why Null Data Matters in Bigfoot Research
Is the secret to finding Bigfoot… nothing?
It might sound strange, but both Bigfoot research and a lot of wildlife science are missing something — and it’s not better cameras or equipment. It’s data… but not the kind you might think.
What we’re missing is null data — the data of literally nothing.
The research trips and investigations where nothing was observed. No sightings, no sounds, no footprints. And yet, these zeros might be some of the most powerful numbers in Bigfoot data science.
Who I Am
Hi, I’m Terrestrial — a naturalist, ex-NASA researcher, and the creator of the Sasquatch Data Project.
I love math, science, statistics, AI, and (of course) Bigfoot. 🌿✨
If those are your jam too, make sure to follow along — we’re bringing scientific rigor into one of the world’s most fascinating mysteries.
What Is Null Data?
When someone goes out looking for a species — say, a heron, a bobcat, or a Sasquatch — and comes back with nothing, that’s null data.
Examples:
A birder spends a day at a pond and sees nothing.
A camera trap runs for weeks and captures no animals.
A hiker reports no unusual sounds or movement.
This kind of information is rarely reported, because people think: “Nothing happened — why would that be useful?”
But from a biological, ecological, and statistical perspective, these blanks are gold.
Why Absences Matter
Let’s step outside the Bigfoot world for a second.
Imagine you’re a biologist studying a rare frog species. You map where frogs are found — that’s helpful, but it’s not the full story.
Without recording where frogs weren’t found, you can’t:
Distinguish between true absences and places no one looked
Compare effort vs. results
Estimate the true probability of finding the species
In ecology, survey teams log every site they visit — even the ones with no detections. That’s how you build a complete dataset, not just a highlight reel.
Presence-Only vs. Presence-Absence Data
Most Sasquatch reports are presence-only: someone saw or heard something and reported it. This kind of data is useful (you can run models like MaxEnt), but it can’t tell you where Sasquatch isn’t.
Presence-absence data, on the other hand, records both:
Where the species was observed, and
Where it wasn’t.
With that kind of data, we can use tools like logistic regression and occupancy modeling, giving us a far clearer picture of where a species truly occurs.
A Selfie Analogy
Think of social media.
People take selfies at famous landmarks — and if you mapped those, you’d see hotspots. But that map wouldn’t show where people aren’t taking selfies.
Selfie posts = presence-only data
Everyone else = presence-absence data
To truly understand patterns, you need both.
The Problem of Imperfect Detection
Even if a species is present, you might not detect it.
Maybe a bobcat walks just behind your trail camera. It’s there — you just didn’t catch it.
That’s called imperfect detection, and it means “no observation” ≠ “absence.”
In Sasquatch research, this could happen if a creature moves behind your camera or observes you unseen. But if we collect enough null data, we can start to estimate detection probabilities — the odds of noticing something that’s actually there.
The basic equation is:
Probability of detection = ψ × p
where ψ = probability the species is present,
and p = probability of detecting it if it is.
If you only have presence-only data, you can’t separate those two variables — but null data lets you.
The Denominator Problem
Right now, Sasquatch data is all numerator — the reports themselves.
But without the denominator (how many times people went out and found nothing), we can’t calculate meaningful rates.
For instance:
Two reports from Yosemite (visited by millions) are not equivalent to two reports from remote wilderness.
Null data gives us context — how many trips, how many nights, how many investigations resulted in nothing. This helps control for effort, just like in birding platforms such as eBird, where observers always log how long they searched and how many people were present.
Handling Absence Carefully
A recorded absence doesn’t always mean true absence — but ecologists handle this by repeated surveys.
If a site is checked five or six times with no detections, the probability of a true absence rises.
So, for Sasquatch fieldwork:
Document every time nothing happens.
It’s not glamorous, but it’s statistically powerful.
What We Can Learn from Null Data
Collecting null data could:
Distinguish real Sasquatch hotspots from human hotspots
Estimate encounter probabilities (e.g., “1 encounter in 100 visits = 1% chance”)
Enable occupancy models, effort covariates, and other mainstream ecological methods
Reveal long-term trends — are reports increasing, decreasing, or stable?
In short, null data lets us move from speculation to testable hypotheses — and that’s what makes it science.
The Takeaway
Presence-only data shows us patterns.
Null data turns those patterns into something testable.
It gives us denominators, detection probabilities, and the ability to place Sasquatch research on the same scientific footing as mainstream biology — and that’s pretty incredible.
So if you’re in the field:
Start recording every time nothing happens. Those zeros matter. 🌿
Stay Connected
If you enjoyed this topic, check out my other work with the Sasquatch Data Project — where we bring science, structure, and statistics into the Bigfoot conversation.
Follow me on:
YouTube, Instagram, Facebook, TikTok: @SasquatchData
Stay curious, stay data-driven, and as always — stay rad.

Beyond Random Chance: Multivariate Analysis of Sasquatch Witness Reports with Lunar, Seasonal, And Psychological Data
Abstract
Historically, reports of alleged sasquatch encounters have been evaluated through qualitative means rather than rigorous statistical analysis. This study analyzed 191 Class ‘A’ sighting reports from a dataset of 776 Class A reports across 17 states, 63 years, and are limited to the South and West regions of the United States. Data were parsed from the Bigfoot Field Researchers Organization and North American Wood Ape Conservancy’s databases of sasquatch witness reports. Three key variables were examined to calculate the probability the patterns that emerged were due to random occurrence. These variables were lunar illumination during encounters, seasonal distribution, and the relationship between witness fear level and reported sasquatch height estimates. Analysis unveiled significant non-random patterns in all three variables. Cycle-corrected moon illumination showed a bimodal distribution with peaks during upper-middle (50-75%) and near-full moon (75-100%) illumination conditions (χ² = 8.717, p = 0.033). Seasonal analysis displayed a predominance of fall and summer encounters (χ² = 21.426, p < 1 × 10⁻4). A significant positive correlation was uncovered between witness fear levels and reported sasquatch heights (r = 0.219, p = 0.0030), with reported average heights increasing from 6.8 ft (SD = 1.5) in mild fear cases to 7.7 ft (SD = 0.9) in extreme fear cases. Combined probability analysis utilizing Fisher's method produced odds of 1:98,348 against these patterns occurring by chance. These patterns align with known wildlife behavior and human psychological stress responses, suggesting either sophisticated coordination of hoaxes or the capture of consistent underlying phenomena in witness reports that warrants further investigation.
Introduction
Cryptozoological studies have traditionally relied on anecdotal evidence and qualitative analysis, often lacking quantifiable investigations or findings. Quantitative studies and statistical analysis of alleged sasquatch encounters have been extremely limited, and typically focused on the physical traits of reported sasquatches (Fahrenbach, 1997), footprint measurements (Krantz, G.S. 1992; Meldrum, 2007), or geographic dispersion of reports (Daegling, D.J. 2005). The systematic analysis of the behavioral traits, environmental conditions, and psychology of sasquatch witness reports has largely remained unexplored.
Extensive databases of sasquatch witness reports have been maintained by two organizations, the Bigfoot Field Researchers Organization (BFRO) and the North American Wood Ape Conservancy (NAWAC). The reports often contain detailed information pertaining to the behaviors and physical traits of the alleged sasquatch, environmental conditions of the encounter, and emotional state of the witness. Individually, the reports may include biases and misidentifications, but large-scale trend analysis in the datasets could reveal how improbable it is these patterns would occur by random chance or independent fabrication of reports.
Examining independent variables within witness reports can strengthen the statistical validity of a multivariate approach. Of particular interest for this study are season and lunar illumination percentages on the date of the encounter, and witness fear level in relation to the estimated height of the reported sasquatch. Utilizing variables that vary independently and encompass both objective environmental conditions (moon illumination, season) and subjective witness experiences (witness fear, estimated sasquatch height) strengthens the analysis by using features that would be difficult to coordinate across hundreds of individual reports. Further, these variables can be compared to patterns of known North American wildlife, human behaviors, and documented human psychological phenomenon, potentially providing frameworks for interpreting any prominent patterns.
Research Objectives
This study aims to:
Examine sasquatch sighting frequency distributions in relation to lunar illumination conditions.
Analyze seasonal patterns of encounters.
Investigate reported witness fear levels in relation to the estimated height of the alleged sasquatch.
Assess the combined probability of observed patterns being the results of random chance or independent hoaxing.
Though sasquatch reports have been collected for decades, they have rarely been subjected to rigorous statistical analysis. The analytical gap in cryptozoology led to polarized viewpoints, either fully accepting or dismissing anecdotal evidence without systematic evaluation. This study aims to introduce a novel approach to examining sasquatch reports by applying established statistical methods across multiple independent variables, focusing on environmental and psychological factors that would be difficult to coordinate in fabricated reports. Rather than attempting to answer the question of existence of the species directly, this approach evaluates the likelihood all patterns in the data emerged by random chance simultaneously or warrant further investigation.
Methods
Data Selection
An initial dataset of 1495 sasquatch witness reports from the BFRO and NAWAC databases were considered. Analysis was restricted to “Class A” (n = 776) sighting reports, in which the witness claims to have clearly seen an ape of unclassified species in North America. Reports labeled as “Class B” (n = 707) or “C” (n = 10) were not included due to a greater risk of misidentification and possible ambiguity of details. Class B reports are met with more uncertainty and describe reports in which the witness is unsure of what they saw, vocalizations, or alleged footprints. Class C reports pertain to secondhand stories and legends. Class designation was extracted from the original classification from the organizations. By examining Class A reports, the possibility of misidentification is minimized, and only includes reports in which the witness is more certain of what they experienced.
Further, data was limited to the South (n = 385) and West (n = 312) regions of the United States, including a total of 17 states. Geographic restriction was implemented to reduce the likelihood of sampling bias from regions with significantly lower report frequencies (Table 1). This decision was made to ensure robust statistical analysis, as the South and West United States regions are of substantial sample size for this investigation. Including multiple regions with substantially smaller sample sizes could introduce sampling bias and reduce the statistical power of this analysis.
Additionally, the analysis only focuses on reports containing four key variables: Lunar illumination of the encounter, season of the encounter, witness fear level during the encounter, and estimated height of the alleged sasquatch. These variables were chosen for their independence from each other and potential correlation with documented humanistic, ecological, environmental, and psychological phenomena. Only including reports containing information pertaining to all four variables is critical to ensuring an equal sample size and robust combined probability using Fisher’s method. Filtering once more to meet this criteria, our final sample size is 191 reports (Figure 1), spanning from the years 1960 to 2023.
All reports were parsed and labeled using a combination of Large Language Model (Anthropic, 2025; OpenAI, 2025) assistance and manual combing. Reports that did not include all criteria listed above were excluded from the main analysis; however, partially complete reports are explored in the expanded dataset and analysis.
Statistical Analysis
The filtering process reduces the sample size considerably, but the final sample size of 191 reports ensures strong statistical reliability for this analysis. For chi-square tests with degrees of freedom ranging from 1 to 4, our sample size achieves excellent power (1 - β > 0.93) to detect medium effects (w = 0.3) and reaches maximum power to detect large effects (w = 0.5) at α = 0.05. The power to detect small effects (w = 0.1) is limited (0.17-0.29), but this analysis is focused on substantive relationships, therefore this is not of concern. The use of permutation tests and bootstrap analyses supports the robustness of this approach.
To control for multiple comparisons, a False Discovery Rate (FDR) correction was implemented using the Benjamini-Hochberg procedure to maintain balance between Type I error control and statistical power. Using only raw p-values for the combined analysis in a multivariate analysis elevates the risk of false significance, and by implementing FDR correction this risk is greatly reduced. The Benjamini-Hochberg procedure was chosen over stricter methods like Bonferoni due to its ability to control the rate of false positives while maintaining higher statistical power. Additionally, the Benjamini-Hochberg procedure scales with the number of tests, making it appropriate for a multivariate analysis. The false discovery rate is set at 0.1 and the critical value is 0.01 allowing for a balanced approach to reduce false positives, while maintaining the ability to detect meaningful trends in the data.
Statistical testing was performed using Python. Particular libraries used included Pandas, NumPy, SciPy, StatsModels, and MatPlotLib. Power analysis calculations for the chi-square test used the GofChisquarePower module from StatsModels.
Lunar Illumination Analysis
Moon illumination percentages were calculated for encounter dates using the Meeus algorithm (Meeus, 1998). Illumination percentages were then divided into four equal-width bins: 0-25%, 25-50%, 50-75%, and 75-100%. A cycle-correction was applied to account for the nonlinear progression of moon phases and disproportionate time spent in extreme lunar phases. This correction adjusted for the natural lunar cycle time distribution of 33.3% for the 0-25% and 75-100% ranges, and 16.7% in the 25-50 and 50-75% ranges. Without correction, a random distribution of sightings would appear artificially elevated at extreme values. A chi-square test was performed on the cycle-corrected data to determine the probability the observed frequencies arose from chance alone. This analysis was performed using the scipy.stats.chisquare function in Python with a significance threshold of α = 0.05.
Seasonality
Reports were categorized by meteorological season following the National Oceanic and Atmospheric Administration’s (NOAA) standard climate definitions based on the encounter date: Spring (March-May), Summer (June-August), Fall (September-November), and Winter (December-February).
Under the null hypothesis of no variation of frequency due to season, encounters would be expected to be distributed evenly across seasons (25% per season). A chi-square test was performed to assess the probability of the observed frequencies occurring due to chance. A bootstrap analysis with 10,000 iterations was employed to obtain robust and conservative probability estimates. Within each iteration, we randomly sampled with replacement from the original dataset to create a distribution of test statistics. This allowed for confidence intervals estimates to be obtained for the chi-square statistic.
Permutation testing was also performed to further evaluate the likelihood of the observed frequency distribution occurring by chance. This involved randomly reassigning season labels to the reports 10,000 times while maintaining the original sample size, then calculating the proportion of permutations that produced a test statistic equal to or more extreme than our observed value. A Benjamini-Hochberg False Discovery Rate (FDR) correction was then applied with a conservative threshold of 0.01.
Witness Fear Level & Estimated Alleged Sasquatch Height
Witness fear levels during the encounter were categorized based explicitly on the testimony given by the witness themselves. Fear levels were divided into the following four groups:
Mild Fear (n = 14)
Definition: Expression of general unease rather than fear.
Statements include feelings of nervousness, feeling “off”, or elevated awareness.
No physical symptoms.
Example Quote: “...it left us feeling uneasy.”
Moderate Fear (n = 51)
Definition: Clear expression of fear, possibly leading to departure from the scene and potential mild physiological responses.
Statements made by the witnesses include the witness feeling definitively scared.
Example Quote: “...feeling spooked I drove out of there fast.”
Elevated (n = 82)
Definition: Increased fear accompanied by physiological responses (e.g., piloerection, increased heart rate, shaking).
Statements made by the witness include feeling “stunned” and “very scared”.
Example Quote: “It had our hearts beating wildly and the hair standing up on our arms.”
Extreme (n = 44)
Definition: Severe fear with physiological responses and possible lasting behavioral impact.
Witnesses may claim to never partake in the activity that led them to their sighting again (i.e. camping, hiking, fishing, etc.)
Example Quote: “This event traumatized me. I have never been able to go in the woods alone or enjoy camping since this event.”
When witnesses expressed a level of fear or unease that straddled two group’s definitions, conservative labeling was applied to default to the lower fear category (e.g., categorizing mild/moderate instances as mild). This methodology was adopted to minimize the risk of overestimating the relationship between fear and height perception.
To analyze the relationship between witness fear level and estimated sasquatch height, the fear level groups were converted to a numeric scale (Mild = 1, Moderate = 2, Elevated = 3, Extreme = 4).
Reported sasquatch heights were extracted verbatim from the witness report and recorded in decimal format. When ranges were provided (e.g., “7-8 feet tall”) the midpoint value (7.5 feet) was used. For reports relying on qualitative descriptors of height (e.g., “taller than my 6 foot tall fence”) the minimum value was used (6 feet). For this particular analysis, obtaining a precise height estimate for the sasquatch is not necessary since we are only interested in the general trend of the height estimates in relation to the witness’s fear level.
A Pearson correlation analysis was conducted to analyze the relationship between witness fear and estimated height using the scipy.stats.pearsonr function in Python, providing both the correlation coefficient (r) and p-value. A permutation test with 10,000 iterations was then implemented to test the null hypothesis that reported heights and witness fear level are independent. Fear level values were randomly shuffled while maintaining original height measurements, preserving marginal distributions and breaking potential association between variables. Using bootstrap resampling with 10,000 iterations, 95% confidence intervals were derived for the correlation coefficient (Efron & Tibshirani, 1994). Descriptive statistics (count, mean, standard deviation, minimum, and maximum) were calculated for reported sasquatch heights within each fear level category. An FDR correction was also applied.
Combined Probability Testing
To calculate the combined probability of all three patterns occurring simultaneously by chance, Fisher’s method was employed using the cycle-corrected lunar illumination p-value, and the FDR corrected p-values for both the seasonal and fear-height data. Using only corrected p-values allows for a more conservative probability estimate.
Results
Lunar Illumination Analysis
This analysis revealed three significant patterns within the sasquatch sighting reports. First, cycle-corrected moon illumination values during the reported sightings showed a non-random distribution (χ² = 8.717, 95% CI [2.398, 25.497], p = 0.0333).
Under a random distribution, the expected frequency was calculated to be 63.7 for the 0-25% and 75-100% groups, and 31.8 for the middle illumination values (25-50% and 50-75%). The raw count distribution (Figure 2A) exhibited a primary peak in the 75-100% range (n = 78, 1.23 times the expected frequency), and a notable secondary peak in the 0-25% range (n = 52, 0.82 times the expected frequency). While the 0-25% frequency was below the expected value, it was substantially higher than the middle illumination ranges (25-75%, n = 57 combined), indicating a nonlinear relationship. The middle ranges (25-75%) displayed lower frequencies (n = 57) than the extremes and the expected frequency under random distribution. However, additional nuance was uncovered when examining the cycle-corrected lunar illumination distribution.
The cycle-corrected data (Figure 2B) displayed two distinct groups within the data. The 75-100% group remained as the highest frequency group (1.23 times the expected frequency), and the 50-75% group also exceeded expectations (1.10 times the expected frequency). The 0-25% and 25-50% groups fell below expected frequencies (0.82 and 0.69 times expected, respectively).
Seasonal Distribution
Seasonal analysis displayed a highly significant non-random distribution (χ² = 21.426, 95% CI [9.043, 44.872], p < 1 × 10⁻4, FDR p < 1 × 10⁻3) . Under the null hypothesis, no seasonal variation would occur (25% per season). However, report frequency peaked during the fall (n = 68, 35.6%) and summer (n = 58, 30.4%), contrasting sharply with the spring (n = 29, 15.2%) and winter (n = 36, 18.8%) frequencies (Figure 3).
The bootstrap analysis confirmed the robustness of these findings. The permutation testing (p = 0.0002) further validated this seasonal preference, suggesting non-random occurrences.
Witness Fear versus Estimated Sasquatch Height
Analysis revealed a significant positive relationship (Figure 4, 5) between witness fear level and estimated sasquatch height (r = 0.219, 95% CI [0.063, 0.366], p = 0.0024, FDR p = 0.0033). Mean reported heights consistently increased as fear increased (Figure 4). Witnesses classified as “mild” consistently estimated lower heights but also the greatest variability (M = 6.8 ft, SD = 1.5), while those showing “moderate” fear reported intermediate heights (M = 7.4 ft, SD = 0.9). Reports where witnesses expressed “elevated” fear reported the tallest heights (M = 7.8 ft, SD = 0.9), and those with “extreme” fear reported similar but slightly smaller heights (M = 7.7 ft, SD = 0.9). The correlation coefficient (r = 0.219) indicates a modest relationship, but the significant p-value suggests it is still meaningful. Permutation testing with 10,000 iterations validated this relationship (p = 0.0022).
Combined Statistical Testing
Combined statistical analysis using Fisher’s method incorporated the cycle-corrected moon illumination p-value and FDR corrected permutation test p-values for seasonal distributions and witness fear correlation. This analysis indicated an extremely low probability of the observed patterns occurring by random chance (p < 1 × 10⁻4). The combined probability of random occurrence corresponds to an odds of 1:98,348.
Expanded Analysis with Full Dataset
To verify the results seen in the filtered dataset were not artifacts of sampling bias, an analysis of the full dataset was conducted with the basic filters in place (Class A sightings from the South and West regions; n = 697). This expanded analysis examined the same three variables (lunar illumination, season, and witness fear level versus height) without requiring complete data for all variables for each report. Each analysis was performed independently, using the maximum number of datapoints for each variable.
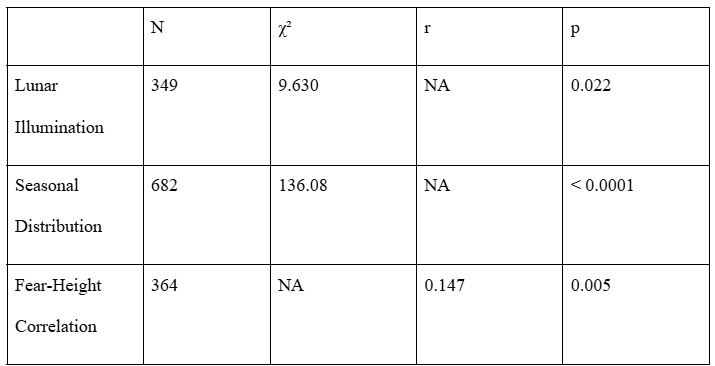
All three patterns observed in the filtered dataset (n = 191) remained significant in the expanded dataset. The raw lunar illumination data (n = 349; Figure S1) displayed a similar bimodal distribution to the filtered dataset with peaks exceeding the expected frequencies for both the 0-25% and 75-100% illumination groups. The cycle-corrected lunar illumination dataset (Figure S2) had a unimodal distribution with only the 75-100% illumination group exceeding the expected frequency (1.20 times the expected frequency), and significant chi-square test results (χ² = 9.63, p = 0.022). Reports occurring during near full-moon conditions (75-100% illumination) were 1.20 times more frequent than the expected value. Reports occurring in the other illumination groups occurred less frequently than expected.
The seasonal distribution (Figure S3) showed a stronger non-random pattern (χ² = 136.08, p < 0.0001) than the filtered dataset. Comparable to the filtered dataset, the summer (n = 253, 1.48 times expected) and fall (n = 240, 1.41 times expected) displayed dominance in sighting frequency over the spring (n = 92, 0.54 times expected) and winter (n = 97, 0.57 times expected).
The fear-height analysis (n=364; Figure S4 and S5) verified a positive relationship between witness fear level and estimated sasquatch height (r = 0.147, p = 0.0049). The correlation coefficient is slightly lower than the filtered dataset’s (r = 0.219), it is still statistically significant, and means increase from 7.2 ft in mild fear cases to 7.6 ft in extreme.
Table S1 summarizes the comparisons between the full and filtered datasets.
Discussion
Pattern Interpretation
This analysis revealed the combined probability the patterns observed in these sasquatch witness reports occurring by random chance is extremely low (p < 1 × 10⁻4). The complexity and consistency of these patterns suggests an alternative to random occurrence or independent hoaxing, especially given the vast temporal and geographic span of the reports. Each pattern potentially aligns with either documented biological, ecological, or psychological phenomenon, suggesting underlying reasons for their occurrences other than fabrication or random chance.
Lunar Illumination Patterns
The statistically significant increase in sightings during high moon illumination conditions (50-100%) versus the lower illumination periods (0-50%) suggests a distinct pattern rather than random occurrence, and deserves to be examined using multiple frameworks. To analyze this trend, three primary lenses are utilized: predator ecology, human activity patterns, and psychological phenomena.
From an ecological perspective, this preference for near-full moon illumination conditions regardless of time of day aligns with behaviors of documented large nocturnal predators (Prugh & Golden, 2013; Packer et al. 2011). Studies have shown that some nocturnal predator species, like black bears (Packer et al., 2011) and coyotes (Prugh & Golden, 2013), display heightened activity during near-full moon conditions. Near-full moon periods can provide increased visibility for nocturnal predators (Todd et al., 2015), influencing predator-prey interactions (Taylor et al., 2023). It has been documented that prey will decrease their activities (Kotler et al., 1991), in some cases from 40-70%, during near full moon conditions in an effort to avoid predation (Taylor et al., 2023), while predators will increase their activities during these times. Though assumptions cannot be made regarding potential sasquatch behavioral patterns, it is clear the frequency of reports, and significance in the uptick during elevated lunar illumination conditions, follows the patterns of other North American predators, leaving room for further analysis.
Increased human activity during full moon conditions has been a topic of study for decades (Packer et al. 2011; Casiraghi et al., 2021; Cajochen et al., 2013) and potentially could explain the increase in sighting reports during this time. Studies have shown animals that predate upon humans will adjust their hunting practices to increase the likelihood of a successful hunt. It has been found that lions in Africa will increase their hunting practices during full moon conditions due to an increase in human activities during these times (Packer et al., 2011). Studies have also shown humans typically sleep less during full moon conditions (Casiraghi et al., 2021; Cajochen et al., 2013), potentially extending the opportunity for outdoor activities. Additionally, contrary to popular belief, this increase in sighting encounters during near-full moon conditions is not likely to be related to increased visual acuity from the witness due to higher moon illumination. The illumination between a new and full moon only differs by one order of magnitude (0.03 to 0.26 lx, respectively), an insufficient amount to aid in human sight (Todd et al., 2015). Another humanistic explanation could be due to memory anchoring. Witnesses may recall events easier when immersed in particular environments (Godden & Baddeley, 1975; Smith & Vela, 2001). Potentially, the presence of a full or near-full moon could be distinctive enough to act as a memory cue, allowing the witness to more easily recall events of anomalous phenomena. Potentially, this could result in increased reports during periods of higher moon illumination.
The consistency and complexity of the lunar illumination pattern across reports spanning vast temporal and geographic frames suggests either a remarkable coincidence, intricate coordination of fabricated reports among witnesses, or signals of activity consistent with documented animal behaviors. The non-random pattern of the data, whether due to a biological entity or not, strongly warrants further study, and in itself provides a testable hypothesis for future research. Future studies could include time of day, weather, or witness activity during the encounter to dive into this variable more in-depth.
Seasonal Distribution
The highly significant non-random distribution of sasquatch sightings across seasons (χ² = 21.426, p < 0.0001) coincides with both ecological and humanistic explanations. Sighting reports peak in both the summer and fall and lulled during the spring and winter. This seasonal variation in report frequency can be analyzed through both ecological and human behavioral concepts.
The autumnal maximum of sighting reports aligns well with documented behavioral patterns of known large North American mammals. Bears, for instance, engage in hyperphagia during the fall in preparation for winter. Hyperphagia leads to significant increases in mobility and daily activities, including larger home ranges (Nelson et al., 1983; Noyce & Garshelis, 1998, Mori et al., 2024). During this period, black bears have been documented increasing their home ranges by 2-3 times (Garshelis & Pelton, 1981), therefore increasing the likelihood of encountering a human. Other large mammals, including moose and elk, have been observed to increase their activities during fall rutting season (Bowyer, 1981; Mysterud et al., 2001). Additionally, large mammals will modify their existing activity patterns and ranges based on food availability (Schwartz et al., 2010). Pre-winter preparations increase activity, leading to cyclical patterns across many North American mammals (Humphries et al., 2017; Sheriff et al., 2011).
From a humanistic perspective, this pattern could be the result of increased human presence in remote areas. Many North American hunting seasons occur in the fall, leading to increased human presence in remote areas (Larson et al., 2014). Potentially, hunters could misidentify other hunters in dark clothing as an anomalous animal. Also, the marked lack of foliage in the fall would allow humans to see up to 60% further into the forest (Kellner & Hubbell, 2017), expanding the opportunity to witness anomalous phenomena. Culturally, autumn is often associated with holidays such as Halloween, a holiday shrouded in supernatural and cryptid topics, which may prime the witnesses leading to possible misidentification or misinterpretation of the event (Wilson & French, 2014).
The secondary peak in the summer could be partially explained by increased human outdoor activity during warmer months (Reilly & Peiser, 2006; Garringa et al., 2021). Recreational outdoor activities, such as camping, hiking, and fishing, generally peak during the summer months (National Park Service, 2024). Increases in human activity could lead to more experiences with anomalous phenomena and potential animal encounters.
From an ecological perspective, many North American animals have been documented as increasing their activities and home ranges during the summer. Juvenile predator mammals in particular, like black bears and cougars, have been documented to leave their family units during the summer and increase their ranges (Schwartz & Franzmann, 1992; Thompson & Jenks, 2010). North American predators may also alter their migratory habits in relation to prey movement, often varying their activity and ranges in the summer (Nelson et al., 2012). Black bears, for instance, have been shown to maintain closer proximity to human residences during the summer while increasing their ranges for foraging (Merkle et al., 2013). Increased animal activity, especially when encroaching on human properties, could lead to increased sighting reports.
The decrease in reported spring sightings is noteworthy in that it contradicts what might be expected following the winter’s lack of resources. Spring typically exhibits a period of increased activity among large North American mammals as they recover from limited winter food availability (Noyce & Garshelis, 1998). The spring’s decline in sightings reported in this dataset warrants further investigation and suggests either distinct biological patterns different from known North American megafauna, or potential reporting biases.
The bootstrap analysis (10,000 iterations) confirmed the robustness of this seasonal analysis, and permutation testing (p = 0.0002) refuted the null hypothesis of a random seasonal distribution. These statistical values strengthen the conclusion that the patterns observed in this data represent a genuine signal rather than an artifact of sampling methodology.
Witness Fear versus Estimated Sasquatch Height
The analysis revealed a positive significant correlation between witness fear and estimated sasquatch height (r = 0.219, 95% CI [0.063, 0.366], p = 0.0024, FDR p = 0.0033), and can be explored using a variety of human psychological frameworks.
The consistency of standard deviations for the moderate through extreme fear groups (uniformly SD = 0.9) contrasts sharply with the mild fear group’s higher variability (SD = 1.5). This pattern potentially represents the effect fear has on perceptual processing and encoding. Witnesses perceiving events during low emotional arousal may rely on analytical processing more than those in a heightened emotional state, potentially leading to a wider variety of spatial size estimates (Balcetis & Dunning, 2010). Conversely, during times of heightened fear, the amygdala’s elevated activity may cause exaggerated, yet more consistent, height estimates (Phelps & LeDoux, 2005) potentially explaining this difference in standard deviation of heights as fear increases. Other factors such as distance to the subject, time of day, and viewing conditions could potentially influence this difference in estimates and warrant further investigation.
The clear progression of increasing average heights from the mild (M = 6.8 ft) to extreme (M = 7.7 ft) fear groups could reflect on a number of subtle psychological effects. If the observed relationship between witness fear and estimated sasquatch height are due to a biological entity, the patterns could suggest larger individual sasquatches elicit a greater fear response from witnesses. Or, the results could suggest witnesses are engaged in fear-induced size distortion, in which the witness perceives the frightening stimulus as larger than it is in reality (Steffanucci & Proffitt; Teachman et al., 2018) . Additionally, the elevated and extreme fear groups have the largest sum of reports (n = 126), potentially explained by the psychological phenomenon of an enhanced ability to recall an event when emotions are heightened (Sharot et al., 2005, Bort et al., 2024).
While the correlation coefficient of 0.219 suggests a low-to-moderate relationship between witness fear and estimated sasquatch height and cannot explain the majority of the variance seen in the data, this is to be expected when dealing with human psychological factors or biological entities.
These patterns are particularly striking, and could be explained using existing psychological frameworks if sasquatches exist as a biological species. Regardless, the significance of the data suggests these patterns are not the result of random or coordinated hoaxing, but of some other cause.
Combined Analysis
The combined probability of all three of these patterns emerging by chance (p < 1 x 10^-4; 1:98,348) suggests an underlying phenomenon within these reports that transcends random chance or uncoordinated hoaxing. This probability is approximately two orders of magnitude smaller than the conventional significance benchmarks of standard (p < 0.05; 1:20) and highly significant (p < 0.001; 1:1,000) thresholds. Comparing this value to significance levels of other disciplines, in biology, ecology, and wildlife studies, a significance level of p < 0.05 is standard, but there are cases where more stringent values of p < 0.01 have been advocated for (Nakagawa & Cuthill, 2007). Psychological fields also typically use the conventional p < 0.05 threshold; some have advocated for a more conservative p < 0.005 threshold in an effort to reduce replication concerns (Benjamin et al., 2018). In fields like particle physics, a significance level threshold of 5 sigma (p < 3 x 10⁻⁷) is required, and it is worth noting ours approaches 4 sigma. While our combined probability does not exceed that of particle physics, it is more than sufficient when compared to the biological, ecological, and psychological sciences and suggests a highly significant result.
The low probability achieved in this analysis lies in the significance of the variables on their own, and suggests achieving such a value would require an intricate coordination of hoaxed reports spanning over six decades and a large temporal area of 17 states. Additionally, it would require the creators of the fabrications to possess subtle knowledge of an array of disciplines, some details not even being known or discovered until after the encounters took place and were reported. Additionally, the patterns seen in this data are highly unlikely to have been randomly hoaxes and transcends random chance. Using a multivariate approach to this subject has shown deeper studies are warranted and further analysis should be conducted on the data as a whole rather than focusing on one single factor.
Expanded Analysis
The expanded analysis corroborated the findings from the filtered dataset. All three patterns from the key variables (lunar illumination, seasonality, and fear-height correlation) displayed statistical significance in the larger dataset, despite less stringent filtering requirements. This consistency across variables suggests the findings from the filtered dataset are robust, and not artifacts of the filtering methodology. The seasonal distribution showed an even stronger effect in the expanded dataset (χ² = 136.08 vs. χ² = 21.426), supporting the findings that sasquatch sighting reports exhibit significant seasonality. The relationship between witness fear and estimated sasquatch height persisted in the expanded dataset, though the effect was slightly smaller (r = 0.147 vs. r = 0.219). These results substantiate our findings from the filtered dataset and conclude that the patterns are not due to filtering bias from the variable and exhibit non-random distributions.
Limitations
The requirements for analyzed reports significantly reduced the sample size from the original 1495 reports to the 191 filtered reports. While enhancing the consistency of the analysis and providing structure for robust probability testing using Fisher’s method, it may introduce selection bias as reports containing all necessary information differ slightly from those with incomplete data. Factors outside of those mentioned here may be at play in influencing the results of this investigation like time of day, length of encounter, and witness activity.
By expanding this analysis to a larger sample of size of any Class A sighting reports from the South or West regions containing information for at least one variable of interest, we were able to corroborate the initial findings. Statistical significance remained for all three variables, showing even stronger trends for the seasonality of reports (χ² = 136.08 versus. χ² = 21.426), and slightly reduced effect size for the witness fear-height relationship (r = 0.147 versus r = 0.219). This highlights the trade-offs between data quality and quantity, again suggesting other variables should be considered when analyzing the data especially for the lunar illumination and witness fear-height investigations.
Additionally, limiting the analysis only to the South and West regions (17 states) may not represent continental trends, as it lessens the geographic spread of the report data. This geographic restriction may inadvertently introduce sampling bias through cultural factors, regional reporting techniques, or area-specific ecological conditions. Enforcing a geographic constraint for this analysis was imperative for strong statistical analysis, but it does hinder the ability to draw generalized conclusions for the entirety of North America.
Lastly, the databases themselves (BFRO & NAWAC) in which reports were collected contain selection biases pertaining to the investigations, categorizations, and classifications of the information within the reports. While each organization does employ standardized collection and reporting techniques, they rely on volunteers to conduct investigations. This introduces the possibility of selection bias in regard to the information that is either included or left out of the public write-up. The available data may not represent a random sampling of all sasquatch encounters. Additionally, witnesses who choose to report their encounter may inherently differ from those who wish to have their encounter remain undocumented.
Despite these limitations, the consistency of the patterns across both the expanded and filtered datasets, coupled with the extremely low probability the patterns occurred simultaneously by chance (1:98,348), suggests further investigation into these reports is greatly warranted.
Conclusion
This study provides the first comprehensive statistical analysis of patterns in sasquatch sighting reports, examining lunar, seasonal, and psychological factors across nearly 200 witness accounts. The results reveal highly improbable correlations that challenge oversimplified explanations of sasquatch sighting reports as either fabrications or misidentified wildlife. The observed patterns - lunar illumination distribution, seasonal preferences, and fear-height correlations - align with established biological, ecological, and psychological phenomena in ways that would require remarkable sophistication to hoax across decades of independent reports, and transcend the possibility of patterns arising from random occurrence.
The lunar illumination pattern, showing peaks during both full and new moon conditions, mirrors both documented behavior patterns of large North American predators and human activities. Seasonal distributions align with optimal foraging conditions and increased human outdoor activity. Perhaps most compelling is the correlation between witness fear levels and reported subject heights, which demonstrates predictable psychological patterns that would be particularly difficult to coordinate across independent hoaxes.
While these findings cannot confirm the existence of an unknown primate species in North America, they demonstrate that sasquatch sighting reports contain internal patterns worthy of serious scientific investigation. The probability against these patterns occurring by chance (1:98,348) suggests either an unprecedented level of sophisticated hoax coordination or the documentation of consistent underlying phenomena.
Future research should expand this analytical framework to examine additional variables, geographic regions, and temporal trends. This work demonstrates the value of applying rigorous statistical methods to cryptozoological data, potentially bridging the gap between anecdotal evidence and systematic scientific investigation. Whatever the ultimate explanation for the sasquatch phenomenon, these results indicate that witness reports contain complex, consistent patterns that warrant further study.
Tables and Figures
Figure 1
Flowchart of Data Filtering Process

Figure 2
Reports Frequency Distributions of Raw and Cycle-Corrected Lunar Illumination Percentages
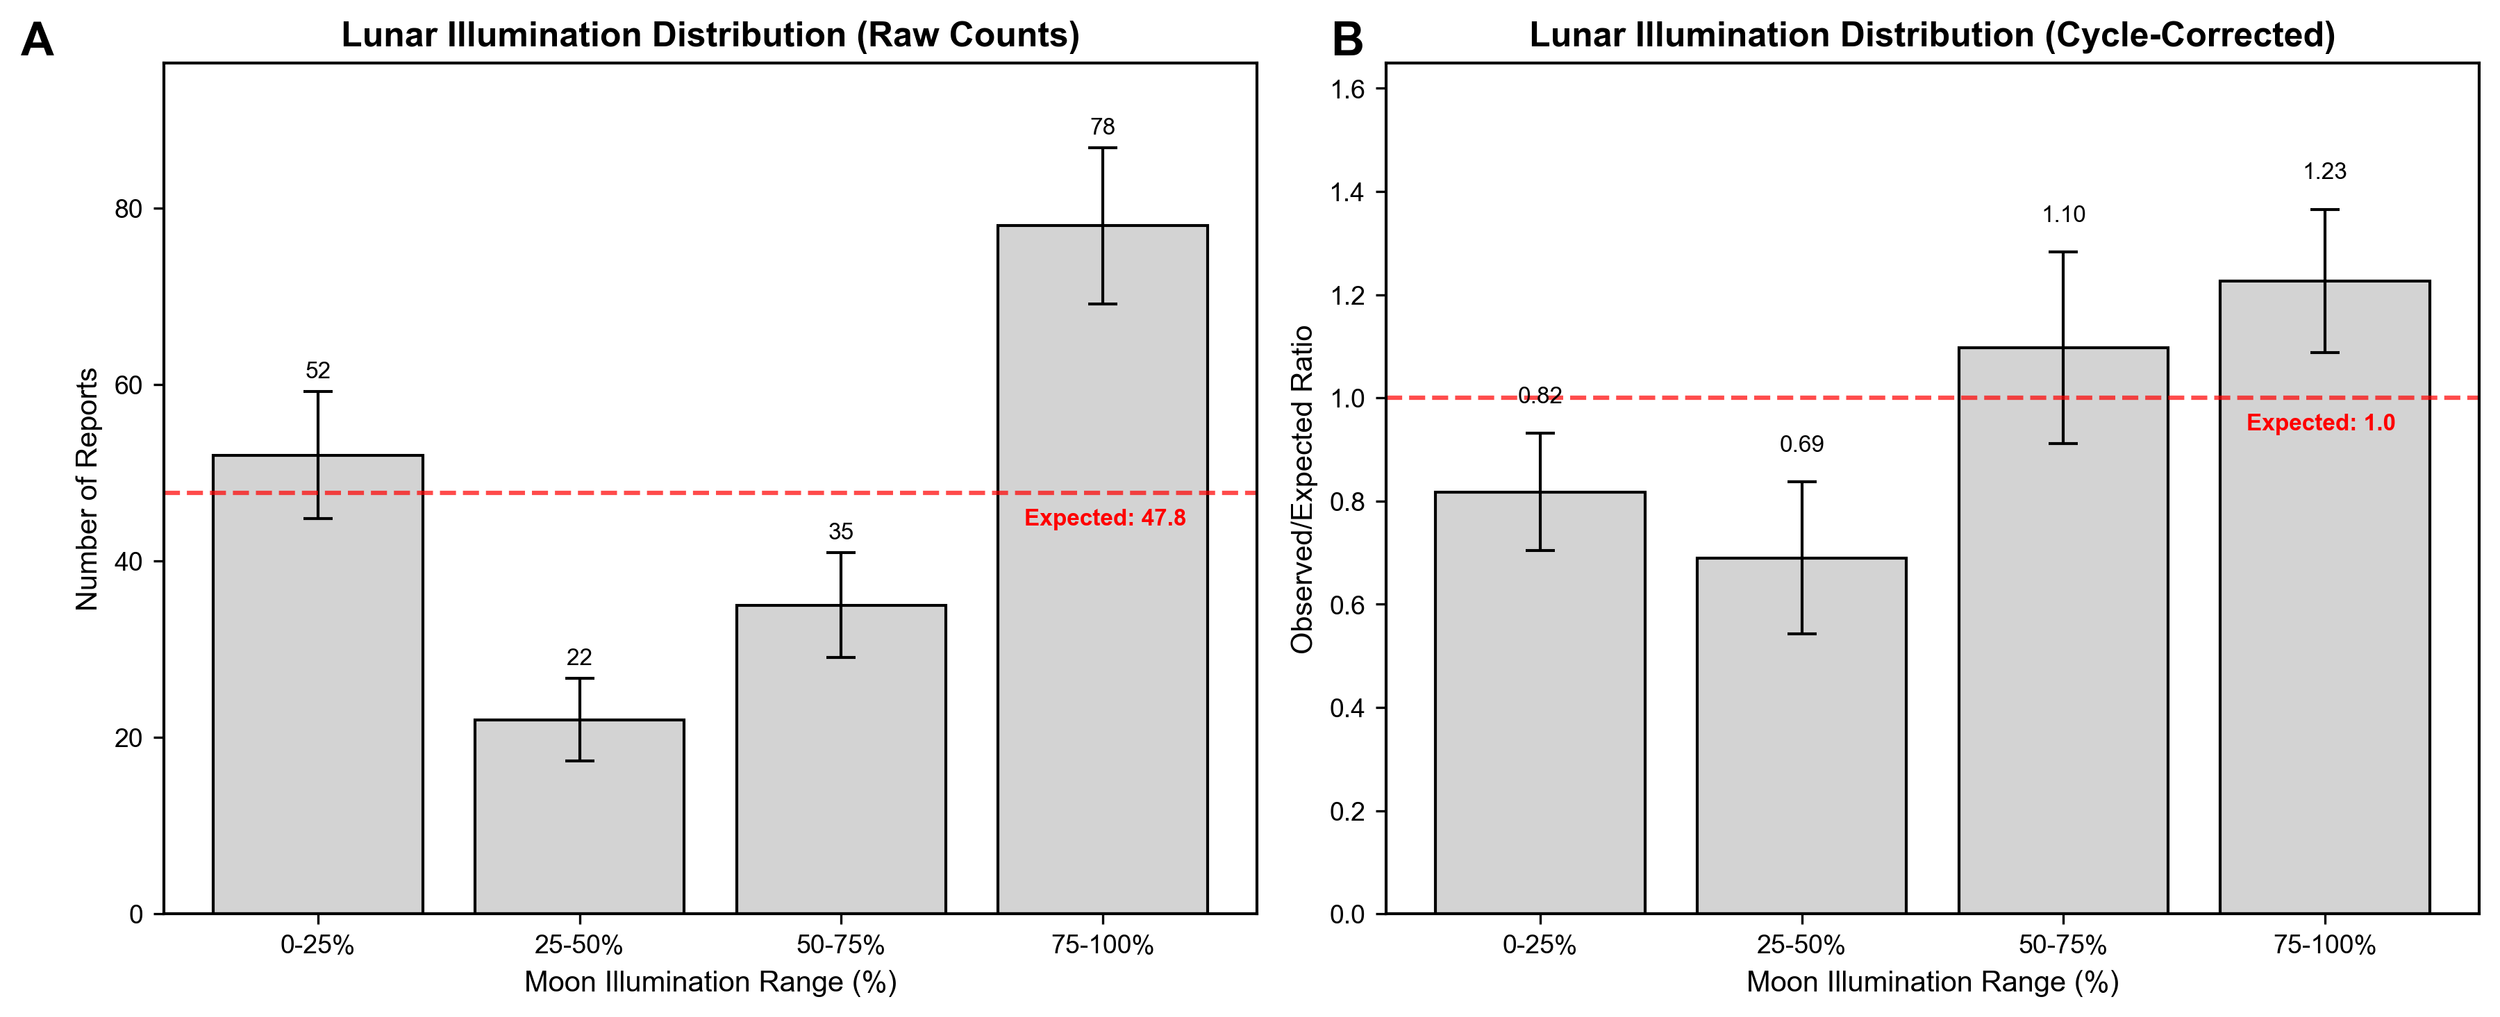
Figure 3
Seasonal Frequency Distributions of Filtered Reports
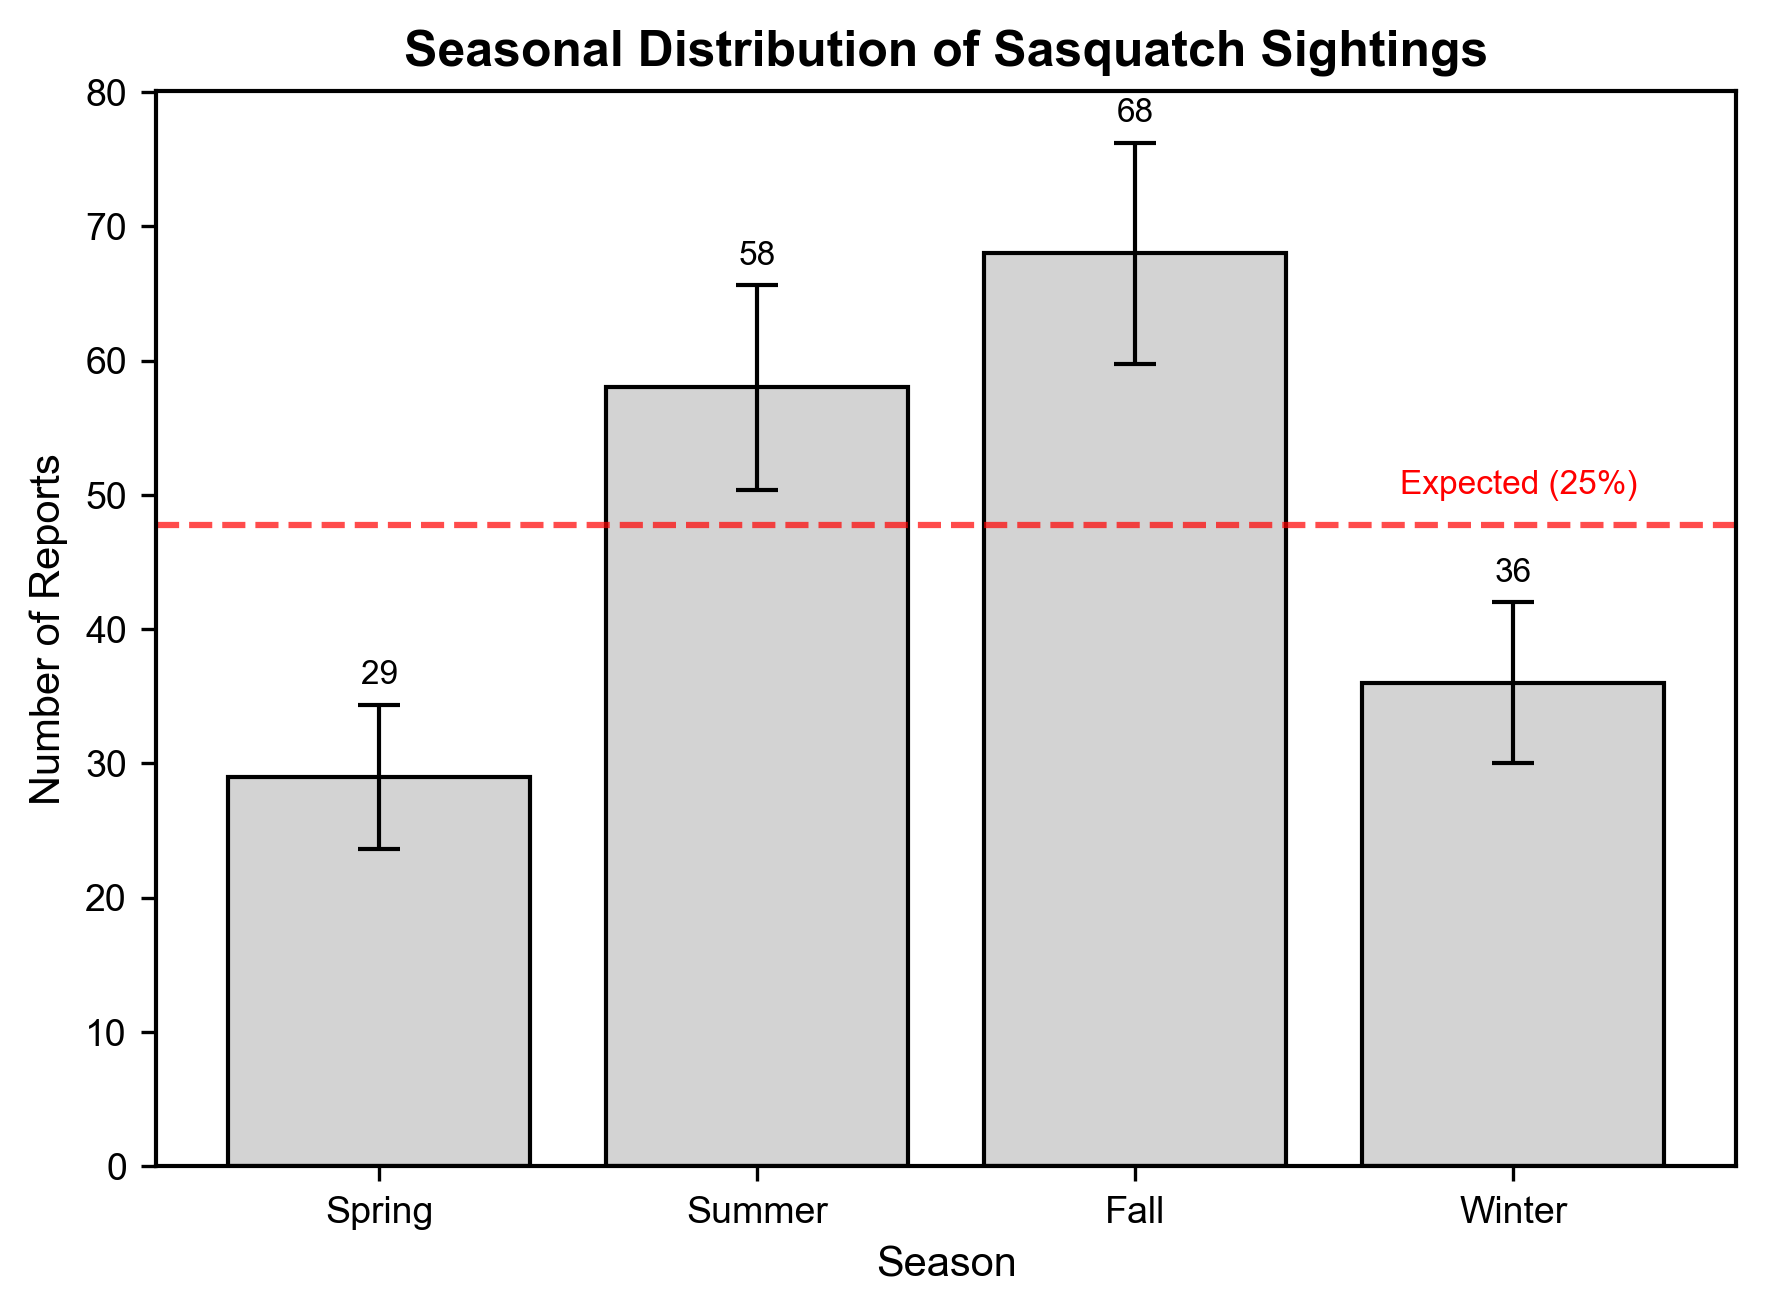
Figure 4
Witness Fear Level in Relation to Estimated Sasquatch Height

Figure 5
Correlation of Witness Fear Level and Estimated Sasquatch Height
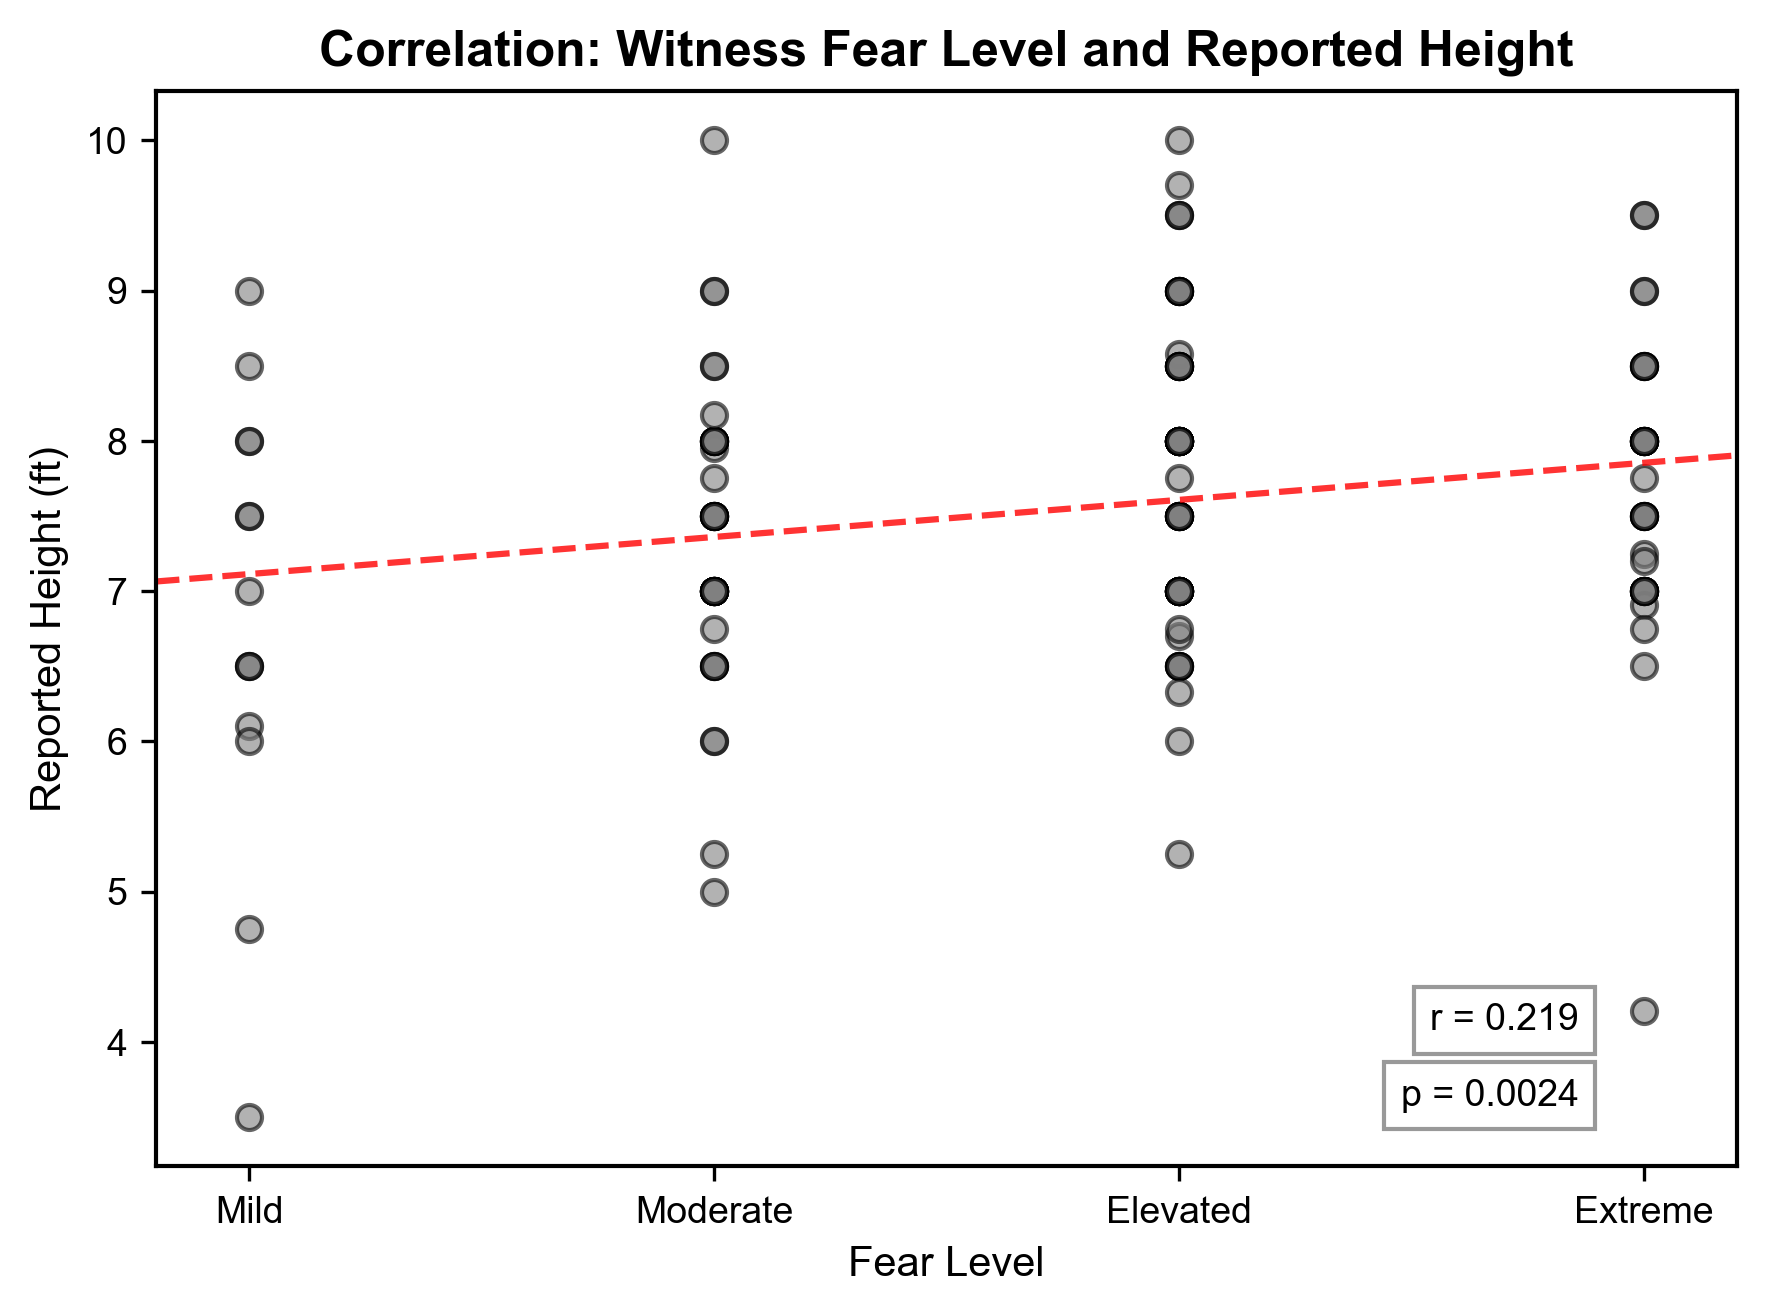
Table 1

Table 2

Table 3

Supplementary Information
The expanded dataset included Class A sighting reports from the South and West regions of the United States (n=697) from the BFRO and NAWAC databases. The expanded dataset uses the maximum number of available data points for each variable, unlike the filtered dataset that requires complete data for all variables in each report.
Figure S1
Raw moon illumination frequencies for Class A sightings in the South and West regions of the USA.

Figure S2
Cycle-corrected moon illumination ratios for Class A sightings in the South and West regions of the USA.

Figure S3
Seasonal sasquatch sighting distributions for Class A sightings from the South and West USA.

Figure S4
Estimated sasquatch heights grouped by witness fear level.

Figure S5
Estimated sasquatch heights grouped by witness fear level.

Table S1
Expanded dataset statistical analysis results
All statistical tests and significance thresholds were identical to those performed on the filtered dataset as described in the primary Methods section. The lunar illumination calculation, cycle-correction, and fear-level categorization followed the same procedures.
References
Balcetis, E., & Dunning, D. (2010). Wishful seeing: More desired objects are seen as closer. Psychological Science, 21(1), 147-152. https://doi.org/10.1177/0956797609356283
Benjamin, D. J., Berger, J. O., Johannesson, M., Nosek, B. A., Wagenmakers, E. J., Berk, R., Bollen, K. A., Brembs, B., Brown, L., Camerer, C., Cesarini, D., Chambers, C. D., Clyde,
M., Cook, T. D., De Boeck, P., Dienes, Z., Dreber, A., Easwaran, K., Efferson, C., Fehr,
E., ... Johnson, V. E. (2018). Redefine statistical significance. Nature Human Behaviour, 2(1), 6-10. https://doi.org/10.1038/s41562-017-0189-z
Bort, V. C., Katsumi, Y., Wirkner, J., Wendt, J., Hamm, A., Dolcos, F., & Weymar, M. (2024). Disentangling emotional source memory: A mega-analysis on the effects of emotion on item-context binding in episodic long-term memory. Frontiers in Psychology, 15. https://doi.org/10.3389/fpsyg.2024.1459617
Bowyer, R. T. (1981). Activity, movement, and distribution of Roosevelt elk during rut. Journal of Mammalogy, 62(3), 574-582. https://doi.org/10.2307/1380404
Cajochen, C., Altanay-Ekici, S., Münch, M., Frey, S., Knoblauch, V., & Wirz-Justice, A. (2013). Evidence that the lunar cycle influences human sleep. Current Biology, 23(15), 1485-1488. https://doi.org/10.1016/j.cub.2013.06.029
Casiraghi, L., Spiousas, I., Dunster, G. P., McGlothlen, K., Fernández-Duque, E., Valeggia, C., & de la Iglesia, H. O. (2021). Moonstruck sleep: Synchronization of human sleep with the moon cycle under field conditions. Science Advances, 7(5), Article eabe0465. https://doi.org/10.1126/sciadv.abe0465
Daegling, D. J. (2005). Bigfoot exposed: An anthropologist examines America's enduring legend. Choice Reviews Online, 42(10), 42-5947. https://doi.org/10.5860/choice.42-5947
Efron, B., & Tibshirani, R.J. (1994). An Introduction to the Bootstrap (1st ed.). Chapman and Hall/CRC. https://doi.org/10.1201/9780429246593
Garriga, A., Sempere-Rubio, N., Molina-Prados, M. J., & Faubel, R. (2021). Impact of seasonality on physical activity: A systematic review. International Journal of Environmental Research and Public Health, 19(1), Article 2. https://doi.org/10.3390/ijerph19010002
Merkle, J. A., Robinson, H. S., Krausman, P. R., & Alaback, P. (2013). Food availability and foraging near human developments by black bears. Journal of Mammalogy, 94(2), 378-385.
Kellner, J. R., & Hubbell, S. P. (2017). Adult mortality in a low‐density tree population using high‐resolution remote sensing. Ecology, 98(6), 1700-1709. https://doi.org/10.1002/ecy.1847
Kotler, B. P., Brown, J. S., & Hasson, O. (1991). Factors affecting gerbil foraging behavior and rates of owl predation. Ecology, 72(6), 2249-2260. https://doi.org/10.2307/1941575
Krantz, G. S. (1992). Big footprints: A scientific inquiry into the reality of sasquatch. Johnson Books.
Larson, L., Stedman, R., Siemer, W., & Baumer, M. (2014). Exploring the social habitat for hunting: Toward a comprehensive framework for understanding hunter recruitment and retention. Human Dimensions of Wildlife, 19(2), 105-122. https://doi.org/10.1080/10871209.2014.850126
Meldrum, D. J. (2007). Ichnotaxonomy of giant hominoid tracks in North America. In S. G. Lucas, J. A. Spielmann, & M. G. Lockley (Eds.), Cenozoic tracks and traces: New Mexico Museum of Natural History & Science Bulletin (pp. 225-231).
Meeus, J. (1998). Astronomical algorithms (2nd ed.). Willmann-Bell.
Mori, T., Mori, S., & Izumiyama, S. (2024). Temporal and individual variation in the feeding habits of Asiatic black bears (Ursus thibetanus). Ecology and Evolution, 14. https://doi.org/10.1002/ece3.11562
National Park Service. (2024, October 17). VUStats dashboard - Social science.
https://www.nps.gov/subjects/socialscience/visitor-use-statistics-dashboard.htm
Nakagawa, S., & Cuthill, I. C. (2007). Effect size, confidence interval and statistical significance: A practical guide for biologists. Biological Reviews of the Cambridge Philosophical Society, 82(4), 591-605. https://doi.org/10.1111/j.1469-185X.2007.00027.x
Nelson, R., Folk, G., Pfeiffer, E., Craighead, J. J., Jonkel, C. J., & Steiger, D. L. (1983). Behavior, biochemistry, and hibernation in black, grizzly, and polar bears. Ursus, 5, 284-290.
Nelson, A. A., Kauffman, M. J., Middleton, A. D., Jimenez, M. D., McWhirter, D. E., & Barber, J. (2012). Elk migration patterns and human activity influence wolf habitat use in the Greater Yellowstone Ecosystem. Ecological Applications, 22(8), 2293-2307.
Noyce, K., & Garshelis, D. (1998). Spring weight changes in black bears in north central Minnesota: The negative foraging period revisited. Ursus, 10, 521-531.
Packer, C., Swanson, A., Ikanda, D., & Kushnir, H. (2011). Fear of darkness, the full moon and the nocturnal ecology of African lions. PLoS ONE, 6(7), Article e22285. https://doi.org/10.1371/journal.pone.0022285
Patterson, B. R., & Messier, F. (2001). Social organization and space use of coyotes in eastern Canada relative to prey distribution and abundance. Journal of Mammalogy, 82(2), 463-477. https://doi.org/10.1644/1545-1542(2001)082
Phelps, E. A., & LeDoux, J. E. (2005). Contributions of the amygdala to emotion processing: From animal models to human behavior. Neuron, 48(2), 175-187. https://doi.org/10.1016/j.neuron.2005.09.025
Prugh, L. R., & Golden, C. D. (2014). Does moonlight increase predation risk? Meta-analysis reveals divergent responses of nocturnal mammals to lunar cycles. Journal of Animal Ecology, 83(2), 504-514. https://doi.org/10.1111/1365-2656.12148
Reilly, T., & Peiser, B. (2006). Seasonal variations in health-related human physical activity. Sports Medicine, 36(6), 473-485. https://doi.org/10.2165/00007256-200636060-00002
Sharot, T., Delgado, M. R., & Phelps, E. A. (2004). How emotion enhances the feeling of remembering. Nature Neuroscience, 7(12), 1376-1380. https://doi.org/10.1038/nn1353
Schwartz, C. C., & Franzmann, A. W. (1992). Dispersal and survival of subadult black bears from the Kenai Peninsula, Alaska. The Journal of Wildlife Management, 56(3), 426-431.
Taylor, P., Swan, M., Sitters, H., Langdon, A., Pinkiewicz, T., & Stringer, D. (2023). Small mammals reduce activity during high moon illumination under risk of predation by introduced predators. Scientific Reports, 13, Article 10532. https://doi.org/10.1038/s41598-023-37166-1
Thompson, D. J., & Jenks, J. A. (2010). Dispersal movements of subadult cougars from the Black Hills: The notions of range expansion and recolonization. Ecosphere, 1(4), 1-11.
Todd, J., Barakat, B., Tavassoli, A., & Krauss, D. (2015). The moon's contribution to nighttime illuminance in different environments. Proceedings of the Human Factors and Ergonomics Society Annual Meeting, 59(1), 1056-1060. https://doi.org/10.1177/1541931215591297
Wilson, K., & French, C. C. (2014). Magic and memory: Using conjuring to explore the effects of suggestion, social influence, and paranormal belief on eyewitness testimony for an ostensibly paranormal event. Frontiers in Psychology, 5, Article 1289. https://doi.org/10.3389/fpsyg.2014.01289

Statistical Significance Testing of Sasquatch Sightings and Moon Illumination
*Data used in this blog was current as of October 1, 2024. More data points have been added to the Sasquatch Data Project’s dataset since, and these findings will be updated in the coming months.
Introduction
If sasquatches are just normal animals, wouldn’t we expect them to engage in normal animal behaviors? In today’s blog, we will once again dive into the potential relationship between sasquatch activity and moon illumination, but this time with statistical significance testing. Testing the data for significance allows us to look at relationships within the data and mathematically support the hypothesis that the trends we see are not due to random chance, but due to some other (in this case) biological reason. This brings up the question, can we prove sasquatches exist with math? The answer is *technically* no, but we can showcase there is data that can mathematically point to them being living, breathing animals.
Before diving into the data, let’s set the foundation on why moon illumination can be used to learn more about sasquatch behavior. Sasquatches are a species of predator in North America. The predator-prey relationship between scientifically recognized North American animals is highly complex and multifaceted. An avenue of interest for our purposes is the intricate balance of predator and prey activity during extremely low and high moon illumination conditions. It has been found there is an increase in predator activity during both extremely low and high moon illumination (Prugh & Golden, 2013). During high moon illumination, there is greater visibility for both predator and prey. Prey have evolved to recognize this and, in some cases, decrease their activity by 40-70% in an attempt to stay alive (Nersesian, Banks, & McArthur 2011; Taylor et al., 2023). Predators have noted this decrease in prey activity during these times so they typically use this as an opportunity to stake out territory, find mates, and reconvene with their groups, therefore increasing their overall activity.
During periods of extremely low moon illumination, prey have learned predators cannot see as well, so they are more actively foraging and roaming. Predators have learned to capitalize on this opportunity and spend more time hunting under these conditions. Both predator and prey are more active during this time.
This is a documented phenomenon of known North American predators like wolves, coyotes, bears, and their prey. If sasquatches are to be a typical North American predator, it is expected they would follow this trend of increased activity under extremely low and high moon illumination. We will begin the study by examining witness reports of sasquatches in an attempt to learn more about their behavioral habits and if they correlate to moon illumination in such a manner.
Method
At the time of writing, 954 witness testimony reports of sasquatch encounters were parsed from the BFRO (Bigfoot Researchers Field Organization) website and added to the Sasquatch Data Project dataset. Of these 954 reports, 501 have been “Class A” sightings of sasquatches. The classification “Class A” indicates the witness visually observed a large ape of unclassified species. Including only Class A sighting reports allows us to remove doubt and ambiguity that the witness actually encountered a sasquatch and can strengthen our confidence in the results. Out of the 501 Class A sightings, 234 reports included an exact date, allowing for a moon phase and illumination to be found. Moon illumination data in conjunction with the sighting report were obtained from the following states: Alabama, Alaska, Arkansas, Colorado, Delaware, Georgia, Maine, Mississippi, Nebraska, Nevada, New Hampshire, North Carolina, North Dakota, Oregon, Rhode Island, South Dakota, Vermont, and Wyoming.
Moon illumination percentages and their frequencies were then grouped into 5 categories: 0-19%, 20-39%, 40-59%, 60-79%, and 80-100%. All moon illumination groups are inclusive of their boundaries. Extremely low moon illumination, like that under a new moon or close to it, is indicated by the 0-19% category. Extremely high illumination, like that under a full or nearly full moon, is indicated with the 80-100% category.
The frequency data was first plotted into a histogram and a polynomial line of best fit was fitted to the plot (Figure 1). A histogram is a quick way to see the overall pattern of the data. It is a visual way to represent the frequency distribution of the sasquatch sighting tallies under each moon illumination category. The line of best fit produces an R^2 value that tells us how well the line fits the data. The higher the R^2 value, the better the fit. Having an R^2 value of 1 means the trendline fits the data perfectly. This rarely happens in biological sciences, and anything over 0.7 is considered a good fit. Anything over 0.9 is an excellent fit. Assessing the R^2 value is a good way to get an initial read on if there is an overall trend in the data.
To evaluate whether moon illumination and sasquatch sighting report frequency are correlated, a chi-square test was performed using the frequency counts of sightings within moon illumination groups. A chi-square test is a statistical test that allows us to determine if the trend or pattern seen in categorical data (i.e. moon illumination, hair color, head shape, etc) is due to random chance or an actual physical reason. To perform a chi-square test, you need to establish a null and alternative hypothesis. The null hypothesis, in this case, states sasquatch sighting report frequency does not correlate to moon illumination. This assumes an equal frequency across all moon illumination groups (i.e. no matter what the moon illumination is, we would expect an equal number of sightings to happen in each moon illumination category), and was used as our expected variable during analysis. Our alternative hypothesis states moon illumination does influence the frequency of sasquatch sighting reports. This is where the chi-square test steps in to both test the two hypotheses and investigate if there is a mathematically significant difference between frequency groups. The chi-square test outputs two values: a p-value and a chi-square statistic. The p-value is an important statistical measurement that indicates how likely the frequencies observed could have happened by random chance. In statistics, a p-value of less than or equal to 0.05 is standard and indicates a less than or equal to 5% chance the observed data occurred by random chance. P-values greater than 0.05 indicate the inability to reject the null hypothesis, or the hypothesis that states sasquatch sighting frequency and moon illumination are not correlated. So if we achieve a p-value less than or equal to 0.05, we can be confident there is a biological or physical reason for the trend seen in the sighting frequencies of sasquatches and their corresponding moon illuminations. If our p-value is greater than 0.05, it is very unlikely the observed frequencies are due to a biological or physical reason. We are hoping to achieve a result of less than 0.05 because this would indicate sasquatches behave like normal, biological predators.
After the chi-square test, the results were further analyzed by comparing the chi-square statistic to the critical value and by using a post hoc pairwise comparison to identify significant differences in frequencies of sightings between different pairings of moon illumination groups. The critical value is a measurement used to again verify that we can reject the null hypothesis. If the chi-square statistic is greater than the critical value, we can once again feel confident the trends and patterns we see in the data are not due to random chance. The post hoc pairwise comparison helps us identify which differences in frequency of moon illumination categories (i.e. 0-19% vs 40-59%, 20-39% vs 80-100%, etc) are statistically significant. It helps to identify which moon illumination values are producing significantly more reports over others, but backed by math. The post hoc pairwise comparison will produce p-values to help us identify the significant differences.
A Bonferroni correction was conducted on the p-values from the post hoc test to decrease the risk of a Type I error on the data. A Type I error occurs when a test reveals a false positive result, meaning the p-value was incorrectly under the designated p-value threshold (in this case 0.05). For final analysis, we will look only at the corrected p-values for the pairwise comparison in an effort to reduce the risk of an incorrect result.
Results

Figure 1. A histogram representing the frequency distribution of moon illumination values for sightings. Note: The upper bounds of each group are not inclusive, except in the 80-100% group.

Table 1. Frequency distribution of Class A sasquatch sightings and their corresponding moon illumination groups.

Table 2. Chi-Square test results of the overall frequency distribution of sighting reports and moon illumination groups.

Table 3. Post Hoc Pairwise Comparisons of the different moon illumination groups including Bonferroni correction.
Results
Moon illumination and frequency of sasquatch sighting reports were significantly correlated (R2 = 0.956, Chi-Square statistic: 56.748 > Critical Value: 9.488, p < 0.001). To identify which moon illumination percentages are significant, a post hoc pairwise comparison and Bonferroni correction were performed (Table 3) and the following pairings of moon illumination conditions were found to have a statistically significant difference in the number of reported sightings:
- 0-19% and 40-59% (corrected p-value: 0.002)
- 0-19% and 60-79% (corrected p-value: 0.047)
- 20-39% and 80-100% (corrected p-value: < 0.001)
- 40-59% and 80-100% (corrected p-value: < 0.001)
- 60-79% and 80-100% (corrected p-value: < 0.001)
Two p-values were deemed too large after the Bonferroni correction for moon illumination group comparisons of 0-19% vs 20-38% and 0-19% vs 80-100%. Checking the effect sizes of each pairing, both are relatively small and this supports the finding that they should be removed from the list of statistically significant comparisons, at least for now.
Discussion
The findings support the hypothesis that sasquatch sighting report frequencies are correlated to extremely low and high moon illumination conditions. The null hypothesis (moon illumination and sighting frequency are not correlated) can be rejected due to the p-value being less than 0.05 and the chi-square statistic being greater than the critical value (Table 2). Sasquatch sighting frequencies during extremely low and high moon illumination conditions points to heightened activity during these times, aligning with scientifically recognized North American predator species behavior. While the increase in sasquatch sightings follows this documented pattern, there could be other factors to influence the increase in apparent activity.
Achieving an overall p-value of <0.05 for the overall analysis and the pairwise comparisons for both extremely high and low moon illumination allows us to reject the null hypothesis. The overall p-value of the chi-square test indicates in itself there is less than a 1% probability these sighting reports occurred in conjunction with their corresponding moon illumination values by random chance. These findings point to one of four scenarios (at least in my mind): 1) If sasquatches are not real animals and all the reports are falsified, the hundreds of sasquatch sighting reporters from the 1920’s to present day, spanning all across the United States, colluded on the dates their reports would have occurred on so this pattern would emerge when someone in the future took the time to look, 2) the less than 1% chance actually happened and these reports just happened to fall into this pattern that matches known animal behavior, 3) there is some sort of human activity increase during these moon illumination conditions therefore leading to more sasquatch sightings, or 4) the findings point to sasquatches being normal animals and taking on normal animal behaviors. Just for fun, let’s explore these options.
Scenario 1 is for all the folks who believe all sasquatch reports are fabricated. If this is true, the hoaxers would have needed to establish this trend in the data either before the BFRO existed or very soon after their inception so they could get this elaborate plan started from the beginning. The BFRO was established in, I believe, 1995. Let’s give the theoretical 234 hoaxers from 18 different states a solid 5 years to come up with a gameplan, and assume they all knew each other in the year 1990 (really this is for ease of calculation). We can easily obtain the populations for each of the states mentioned above along with the number of reports from each state that have a moon illumination percent associated with it (the sample value). We can then use the population and sample sizes to get a very rough probability calculation that all of these people even knew each other. Just to give the faux hoaxers even more of a leg up in this scenario, we will have a loose definition of “knowing each other” and include a friend of a friend relationship to one another, creating more of a social chain over a social circle. Using a simple, very rough population calculation, the chances these 234 people were somehow connected in any way in the year 1990 is approximately 0.44%. This is actually a higher percentage than I was expecting, but is still far less than a 1% chance. This is assuming every single person followed through with the scheme as well, and that factor is not included in the calculation. This calculation also does not include a 1990 social dynamic factor, and an accurate estimate on the level of connection between states (in this case we have an overestimate of the state-to-state connection). So this result of 0.44% is actually quite generous. In an effort to get a more accurate probability, I also conducted a Monte Carlo simulation and included factors like a local community factor (the chances people know each other in the same state), an interstate factor (the chance people in different states know each other), a technology factor (limited long-distance technological communication in 1990), a profession factor (knowing someone because of a job), and a family factor (extended family across state lines). A Monte Carlo simulation basically runs a set number of simulations on the scenario in question and produces a probability for each simulation. It then averages the probabilities to give an overall probability that the scenario could happen. In this case, the simulation was attempting to make the 234 person connection with the given sample sizes, populations, and social factors. The result was a resounding 0.000000. The simulations were never able to achieve the result within 10,000 separate simulations, therefore giving us a basically impossible scenario. Just for fun, I ran the simulation 50,000 times and still achieved the result of 0. So, after looking at the calculation and simulation results, somewhere between 0 and 0.44%, but more so leaning towards 0, is the chance this is an elaborate hoax pulled off by a bunch of very bored people in the 1990s. We can feel confident this is not the result of hoaxing, let’s move on to scenario 2: A freak of nature occurred and these results are due to random chance.
Typically in academic writing, a p-value less than 0.001 is just reported as so for ease of interpretation. In this case, though, I would like to mention the exact p-value calculated for the overall trend in sasquatch sighting frequency and moon illumination was 1.397x10^-11. In plain text that is 0.00000000001397. So there is a 0.000000001397% chance the results seen in the data happened by random chance. This would be nearly impossible, and there isn’t much more to say about it. We can confidently rule this out as a possibility.
A third reason for the increase in sightings could be a human factor.The working hypothesis from sasquatch researchers is that under full moon conditions humans can see better therefore leading to more sasquatch sightings. From the research that has been conducted on the luminance of a new vs full moons, I do not think this is the case. Luminance during a new moon versus that of a full moon only differs by one order of magnitude (0.03 & 0.26 lux, respectively) and is not enough to make a significant difference in a human’s ability to see at night (Todd et al. 2015). Even under full moon conditions, the luminance produced by the moon only is less than what is recommended for common human tasks. For example, the recommended luminance for a movie theater’s house lighting during the film is 1-2 lux and does not include the luminance brought on by the film itself (Rea, 2000). An illumination of 30 lux is recommended to successfully navigate a public space or read (Rea, 2000). Therefore, the terrestrial luminance of the moon is less than sufficient in aiding human sight (Todd et al. 2015). Additionally, this study did not take into consideration time of day and looked at the influence of the moon’s illumination and phase as a whole. Of the 234 data points used in this blog, 103 occurred during the daytime which I defined as 7AM to 7PM. Obviously, these times fluctuate through the year and are based on location so there will be some discrepancy in an exact number. For now though, nearly half of the data that produced these results happened during the day, so there is some kind of factor outside of the illumination itself influencing sasquatch behavior.
With a human’s sight out of the picture, perhaps humans are more active in general under extremely low and high moon illumination, leading to an increase in sasquatch sightings. Humans are predators after all, so wouldn’t we expect them to also follow this trend of increased activity during extremely low and high moon illumination conditions? Not quite. The main difference between the predator behaviors of humans and sasquatches is that humans are not nocturnal, while it is suspected sasquatches are. Nocturnal predators are far more influenced by the lunar cycle compared to their diurnal counterparts. Humans following the lunar cycles is driven more so by cultural norms, personal preference, and sleep patterns. It has been found under full moons humans sleep less and take longer to fall asleep (Casiraghi et al. 2021). It was found that throughout the duration of the lunar cycle, the difference in the amount of sleep participants got overall differed from 20-90 minutes depending on the lunar phase. The study found under new moon conditions humans slept up to 25% more than under full moon conditions. It is worth noting the researchers were also studying how artificial light interfered with sleep cycles. So possibly if humans are awake longer, at least under full moons, they would have more of an opportunity to see a sasquatch. This could possibly be a reason for the increase in high moon illumination sightings, but it does not explain the increase in sightings during new moons.
The last scenario at this point seems the most likely. Sasquatches are normal animals doing normal animal things. If we had gotten these results for, say, a coyote, no one would bat an eye. A sigh & exasperated “DUH” would erupt from the scientific community. But for some reason an ape that stays out of everyone’s way and is just living their best predator life makes everyone uncomfortable. *Shrug* Proceeding with the most logical of the scenarios, let’s look at the data.
This study found sightings of sasquatches are most frequently reported under extremely high moon illumination values (80-100%) and this increase is significant compared to the middle moon illumination values, indicating sasquatches are more mobile during these periods of time. While the full moon’s illumination was not enough to make a difference in human sight, it is enough to cause a noticeable difference in visibility for nocturnal animals (Auselbrook et al. 2022). It is thought sasquatches are nocturnal due to a number of reports mentioning the presence of eye shine. The Sasquatch Data Project’s dataset has currently noted 37 Class A sighting reports of sasquatches that claimed the presence of eyeshine. There have been 7 reports that did not claim eyeshine in a situation that “should” have produced it (i.e. headlights directly on the eyes, a flashlight shining on the face, etc.). If sasquatches are truly nocturnal (though I am not quite convinced, but that is for a later blog) changes in the moon illumination even by just an order of magnitude could potentially have a significant impact on their ability to see, therefore increasing their mobility and activity levels as seen in other nocturnal animal species (Auselbrook et al. 2022). This increase in visibility for nocturnal predators would allow them to cover more ground in staking out territory, find family groups and mates easier, and help them hunt a rogue prey animal who didn’t get the memo about being eaten easier. Chimpanzees, though diurnal like all other ape species, have adopted nocturnal behaviors due to human intrusion into their environment. One group in particular was found to be more actively foraging and on the hunt for mates during nights with a full moon (Krief et al. 2014). So it is possible sasquatches could be partaking in similar activities during these conditions since it is known ape behavior. To truly understand the extent of moon illumination on sasquatch activity, we need to study how sighting frequency increases and decreases with moon illumination during day and night instead of as a whole. At this time more data needs to be collected to conduct that study, but preliminary analysis shows regardless of time of day the results of this blog stay consistent. So, for now a possible explanation for the increased sighting report frequency under high moon illumination could be that sasquatches can see significantly better compared to new moon conditions, and are more active.
Increased sightings under new moon conditions were also statistically significant, and can also support the hypothesis they are more active during these conditions. This could potentially be a fruitful time for them to hunt due to the predator-prey relationship. As stated previously, prey are more active under lower moon illumination, therefore increasing the activity levels of predators. Sasquatches are likely following this trend. They may also be more active under low moon illuminations due to decreased visibility, so it may take them longer to forage and hunt or meet up with others in their family groups. In the same chimpanzee study mentioned previously, a different group of chimpanzees were actually more active under new moon conditions as opposed to a full moon night (Krief et al. 2014). They were partaking in the majority of their hunting and foraging during these conditions potentially to avoid humans or due to the maturation stage of the particular crop they were interested in (Kreif et al. 2014). Potentially sasquatches could be exhibiting similar behaviors under low moon illumination. They could be attempting to avoid detection from humans, so they wait for lower moon illumination to come in closer to human proximity thinking it will help keep them under the cover of darkness. It is difficult to say at this point what else may be driving this behavior since sasquatches, if truly nocturnal and not showing cathemerality, would be the only nocturnal ape species. We can look at the behaviors of the few nocturnal primates in existence (like the loris and lemur), but they are not top predators in their environments so their motives may be a bit different from a sasquatches. Also, while it is fascinating how chimpanzees have adopted nocturnal behaviors, it is important to once again remember they are not truly nocturnal, so there will be differences in the behaviors of sasquatches and chimpanzees. Looking only at apex predators in North America who exhibit similar behavioral patterns, we can say with some confidence this trend is related to obtaining a food source in some capacity.
Conclusion
I am quite excited by these results, but it is important to mention that I still have thousands of reports to parse off the BFRO website. While I have more than enough data points to support a chi-square test (only 30 data points are needed to run analysis for this test. I used 234), more data is always better to strengthen the results. I am eager to see how these findings may change over time, but for now there does seem to be a strong relationship between moon illumination and sasquatch sighting reports. To me, this supports the idea that sasquatches are just normal apes doing normal ape things and follow known predator behavior.
*Updated 11/1/24

Humans or Sasquatches: Yelling Vocals in Northeast Georgia
Update 6/8/2025: I chatted with some folks at the Olympic Project about this audio and have concluded this clip most likely contains humans. Doing what? No clue, but something weird!
I have been conducting sasquatch and wildlife research on 20+ acres of land in the foothills of the northeast Georgia mountains for the last three weeks. Research has included setting trail camera, daily walks to look for sign, and audio recording at night. This past week has produced interesting, and potentially significant, results including an audio recording of a pack of wolves (which are not known to reside in Georgia anymore) and a truly bizarre 6 second clip of incoherent chatter and yelling. This blog will be discussing the yelling audio, but let’s set the scene of the environment first.
This land is just over 20 acres that is surrounded by 150+ acres of woods. There are some homes and farms in the area as well with approximately 50 acres of pasture. A major creek runs through the property and is a prominent source of water for the local fauna. There is a large herd of deer of about 20 individuals that roam the property daily. Turkeys, coyotes, rabbits, foxes, opossums, racoons, and even a peacock are frequently seen on the land as well. A lone black bear is also known to pass through the area on occasion. This property and the land surrounding it comprise a sanctuary for wildlife.
The clip itself was recorded on a Zoom Handy H4 recorder facing the 150+ acres of woods. I typically begin recording when things quiet down inside the house to mitigate ambient noise. I confirmed with all people in the house that night that none of us made any noises that resembled what I captured on the recorder.
The Recording
On August 9, 2024 around 9:45PM EST the following audio clip was recorded. The moon phase that night was a waxing crescent and the illumination registered at 22%. It was a clear night and the temperature hovered around 80 degrees.
Headphones are strongly encouraged when listening to the recording.
Spectrogram of the vocals.
The clip speaks for itself. It is just bizarre. It almost sounds like a clip from a cartoon. To me, there are clearly at least 2 individuals. The source could absolutely be two humans fighting about something and screaming, but it is perplexing why it starts so abruptly and ends just as quick. Before and after this clip, there are no other noises of this caliber. Bugs and a rogue dog are present, but nothing that sounds like this. I cannot rule out humans, but it is strange the noises seemed relatively close to the recorder, yet words cannot be distinguished it just sounds like incoherent yelling.
To clean up the recording a bit, I filtered out frequencies below 300Hz and above 1400Hz. Listen below.

Segment 1
Let’s break the spectrogram into pieces for analysis. Segment 1 is what I call the “slide whistle”. I have no explanation for what that is, but it seems to set off the entire series of events and vaguely sounds like a slide whistle. I truly have no idea if this is actually a whistle, a bird, one of the individuals, or something totally unrelated. I have not recorded anything that looks like this piece of the spectrogram or sounds like it up until this point or since.

Segment 2
Segment 2 just sounds and looks like a big dude yelling/groaning. Whether it’s a human or sasquatch, who knows, but I feel quite confident in saying it is some kind of ape. I really don’t know what else to say about it.

Segment 3
Segment 3 throws me off. Upon first playthrough, I thought this section was a dog barking (therefore deemed the “dog bark” segment) until the third piece of the segment. In the third piece, the first formant (F1) has a frequency that is approximately equal to the F1 frequency seen in the first two sections. Also, when comparing this section to recordings I’ve obtained of actual dogs barking in the night it does not match up with their frequencies, intensity, or duration of the bark. I have no idea what this is and cannot comment more.

Segment 4
Segment 4 sounds like another individual screaming and then the “conversation” stops as quickly and abruptly as it started. Really, that’s all I know to say about it. I am not well-versed enough in phonetics and reading spectrograms to take it much further than that.
Obviously, this could be people fighting somewhere close by, especially since I recorded this at such an early hour and there are other houses around. This is absolutely not out of the realm of possibility, and I may be putting someone’s drama on blast (lol), but I find it odd they are not able to be understood at all for how close they were to the recorder. Also, the recorder was placed away from property lines so someone would have to be trespassing on the property for the noises to register so loudly, which is entirely possible. I also find it odd there is no lead up to this set of vocals. It just begins out of the cicadas and silence, then ends. There is no lead up or follow through. The vocals themselves last about 6 seconds then it’s just back to the ambient noises of the night. So odd.
Really the only reason sasquatch is on my radar is due to pieces of this audio reminding me of the famous Sierra Sounds. If you are not familiar with this audio, give it a listen here. The Sierra Sounders were obtained in the 1970’s in the Sierra Nevada Mountains and is purportedly sasquatches making a number of noises and sounds. Apes are capable of a range of vocals, so I would expect sasquatches to be no different.
I will continue to monitor the area, but I wanted to share this weird clip whether it be human or something else. Let me know what you think it is in the comments!

Moon Illumination & Sasquatch Activity Levels

At the time of publication, over 650 reports have been added to the Sasquatch Data Project dataset. Figures and data used in this blog are from a previous version of the dataset.
Introduction
Fluctuations in moonlight intensity greatly influence the behaviors of both prey and predators (Price, Waser & Bass 1984). The influence of moonlight on sasquatch activity has been a topic of debate among bigfoot researchers for decades, yet there has not been a data-driven study to explore this phenomenon. The Sasquatch Data Project is stepping in to put data at the forefront of this discussion. Part of the mission of the Sasquatch Data Project is to bring clarity to the behavior, appearance, and social dynamics of sasquatches through data from witness testimony. This blog will be looking into the activity levels of sasquatches in relation to moon illumination to explore the possibility of correlation between the two in an effort to learn more about the complex behavioral systems of sasquatches.
Methods
The Sasquatch Data Project is currently building its dataset from the Bigfoot Field Researchers Organization (BFRO) website’s expansive collection of witness reports. The reports, which are in plain text format on the website, are meticulously sifted through to extract as much information as possible, then organized into a spreadsheet optimized for data analysis and coding. At the time of writing, a total 602 reports have been examined, and 16 states that have been documented including Alaska, Alabama, Arkansas (incomplete), Delaware, Maine, Mississippi, Nebraska, Nevada, New Hampshire, North Carolina, North Dakota, Oregon, Rhode Island, South Dakota, Vermont, and Wyoming (incomplete). While moon phase and illumination are not typically stated in the reports, they can be easily obtained through a moon phase “calculator” when an exact date of the encounter is given. Thus, for the majority of reports, that is how the illumination percentage and phase are found. Within the dataset, a classification system has been devised to generally describe the encounter detailed in the witness report. I have identified 5 different “Observation Types” and they are as follows:
Animal: A clear view of a sasquatch was seen by the witness.
Vocalization: A proposed sasquatch vocalization was heard by the witness. I.e. scream, howl, grunt, whistle, etc.
Activity: General sasquatch activity was reported. I.e. bipedal walking/running noises, tree shaking, intimidation displays, rock throwing, etc. A sasquatch was not seen.
Footprint: A footprint(s) was found in substrate by the witness.
Wood Knock: A distinct wood-on-wood sound (or similar) was interpreted by the witness.
Of all the reports, these are the main groups I have identified that are efficient in giving a broad overview of the witness’s experience. These groups are further defined into subcategories called “Encounter Type” (road crossing, camping activity, intimidation display, etc.), but those are not currently relevant for this particular investigation. Due to current data limitations, a more general sense of sasquatch activity will be considered.
Limitations
Before proceeding, it is important to note limitations in the dataset. The type of data the BFRO provides is known as “presence-only” data. This represents only when an event was reported, not every time the event occurred in nature. A person had to experience it, then report it to the BFRO to be recorded. Not everyone does this because they either (1) simply do not want to, (2) do not know such a manner of reporting to an organization exists, or (3) some other completely valid reason. Although it is ideal to have data recorded during non-event periods, the use of presence-only data is entirely acceptable.
Additionally, there is inherent error within witness testimony. To many, having an experience with a sasquatch is extremely distressing, thus affecting their ability to retain particular details and potentially introducing false memories due to the stress and trauma (Kaplan et al. 2015). Witnesses also may not record their experience immediately following, introducing inaccuracies in details and dates. While witness testimony is not completely concrete, the bulk of current sasquatch data lies within it, therefore we must acknowledge these inaccuracies and proceed in investigating.
Data
At the time of writing, 602 reports from the BFRO dataset have been parsed. Of these 602 reports, 272 reports described by the 5 main “Observation Types” have included an exact date therefore allowing a moon illumination percentage to be obtained. Also, for the sake of clarity, when referencing the “Activity” category from the dataset, I will always capitalize the word. When referencing general sasquatch activity (this could include a vocalization, sighting, or any general encounter type), it will not be capitalized. I recognize this can be confusing and will rename the category at a later date.

Figure 1. Counts of observation occurrences for the main observation types and their corresponding moon illumination percentage values. Data is not filtered for time.
Figure 1 includes all 272 reports, showcasing the counts of specific Observation Types and their corresponding moon illumination percentage grouped into 20% intervals. Grouping moon illumination values in either 20% or 25% intervals is typical and a valid way to bin the data. This figure does not take into account the time of day and shows the overall trends regardless of time. Data filtered by time will be introduced in Figures 2 & 3. It is also important to note Google Sheets does not incorporate the upper bound of the group into the bin. The group 0-20% includes moon illumination values of 0-19.9%. The group 20-40% includes percentages 20-39.9%, and so on. The groups start at the first value and go up to, but do not include, the upper bound. The only exception to this is the last group 80-100% where both values are included in the bin.
Illustrated in Figure 1, the data is prominently U-shaped, showing peaks in frequencies of all observation types under the extreme low (0-20%) and high (80-100%) moon illumination conditions, and substantially lower occurrence counts within the intermediate groupings. Most notably, the number of sasquatch sightings and vocalization reports peak in both the high and low ranges, exceeding double the number of occurrences compared to the intermediate moon illumination groups. The counts of Observation Types for all categories, except “Activity”, reaches a minimum in the 40-60% range. Isolated wood knocks are completely absent from this moon illumination range.
Figure 1B confirms we have U-shaped data through the very high R^2 values of the polynomial trendlines. R^2 values represent how well the equation of the trendline fits the data. The closer to 1 the better. In our case, R^2 values greater than 0.9 indicate less than a 10% chance the model cannot explain the variance in the data, meaning the data it can predict is not likely up to random chance. R^2 values for the “Animal”, “Vocalization”, and “Activity” types come in at 0.943, 0.954, and 0.901, respectively. Th R^2 values could potentially be significant if the values hold strong as more data is added to the dataset. Because of the current lack of data regarding the “Footprint” and “Wood Knock” Observation Types, these values will be disregarded for the remainder of the blog.

Figure 2. Counts of Main Observation Types and their corresponding moon illumination percentages for times 8:00PM to 6:00AM.
Figure 2 depicts the 129 data points of nighttime occurrences of each primary observation type along with its corresponding moon illumination percentage. For this study, nighttime is defined as 8:00PM to 6:00AM, but not including 6:00AM. This timeframe was selected in an effort to only look at times when the moon’s light would be most prominent. It is important to note these times change throughout the year with earlier and later sunrises and sunsets. Until more data is available, this is the chosen method of filtering the data.
The same general trends regardless of time of day follow into the night data. The main differences being the stark decrease in sasquatch sightings in the 0-20% group compared to the other categories. The majority of sasquatch sightings and general activity are happening under high moon illumination values in the 80-100% range. The majority of vocalizations are held within the 0-20% and 80-100% ranges.
The trendlines again see strong R^2 values, this time coming in at 0.91, 0.966, and 0.801 for the “Animal”, “Vocalization”, “Activity” categories, respectively. The “Activity” observation type dropped by 0.1, but in the biological sciences an R^2 value above 0.7 is generally still considered strong, and even 0.5 can be acceptable. Again, the model is efficient in fitting the data.
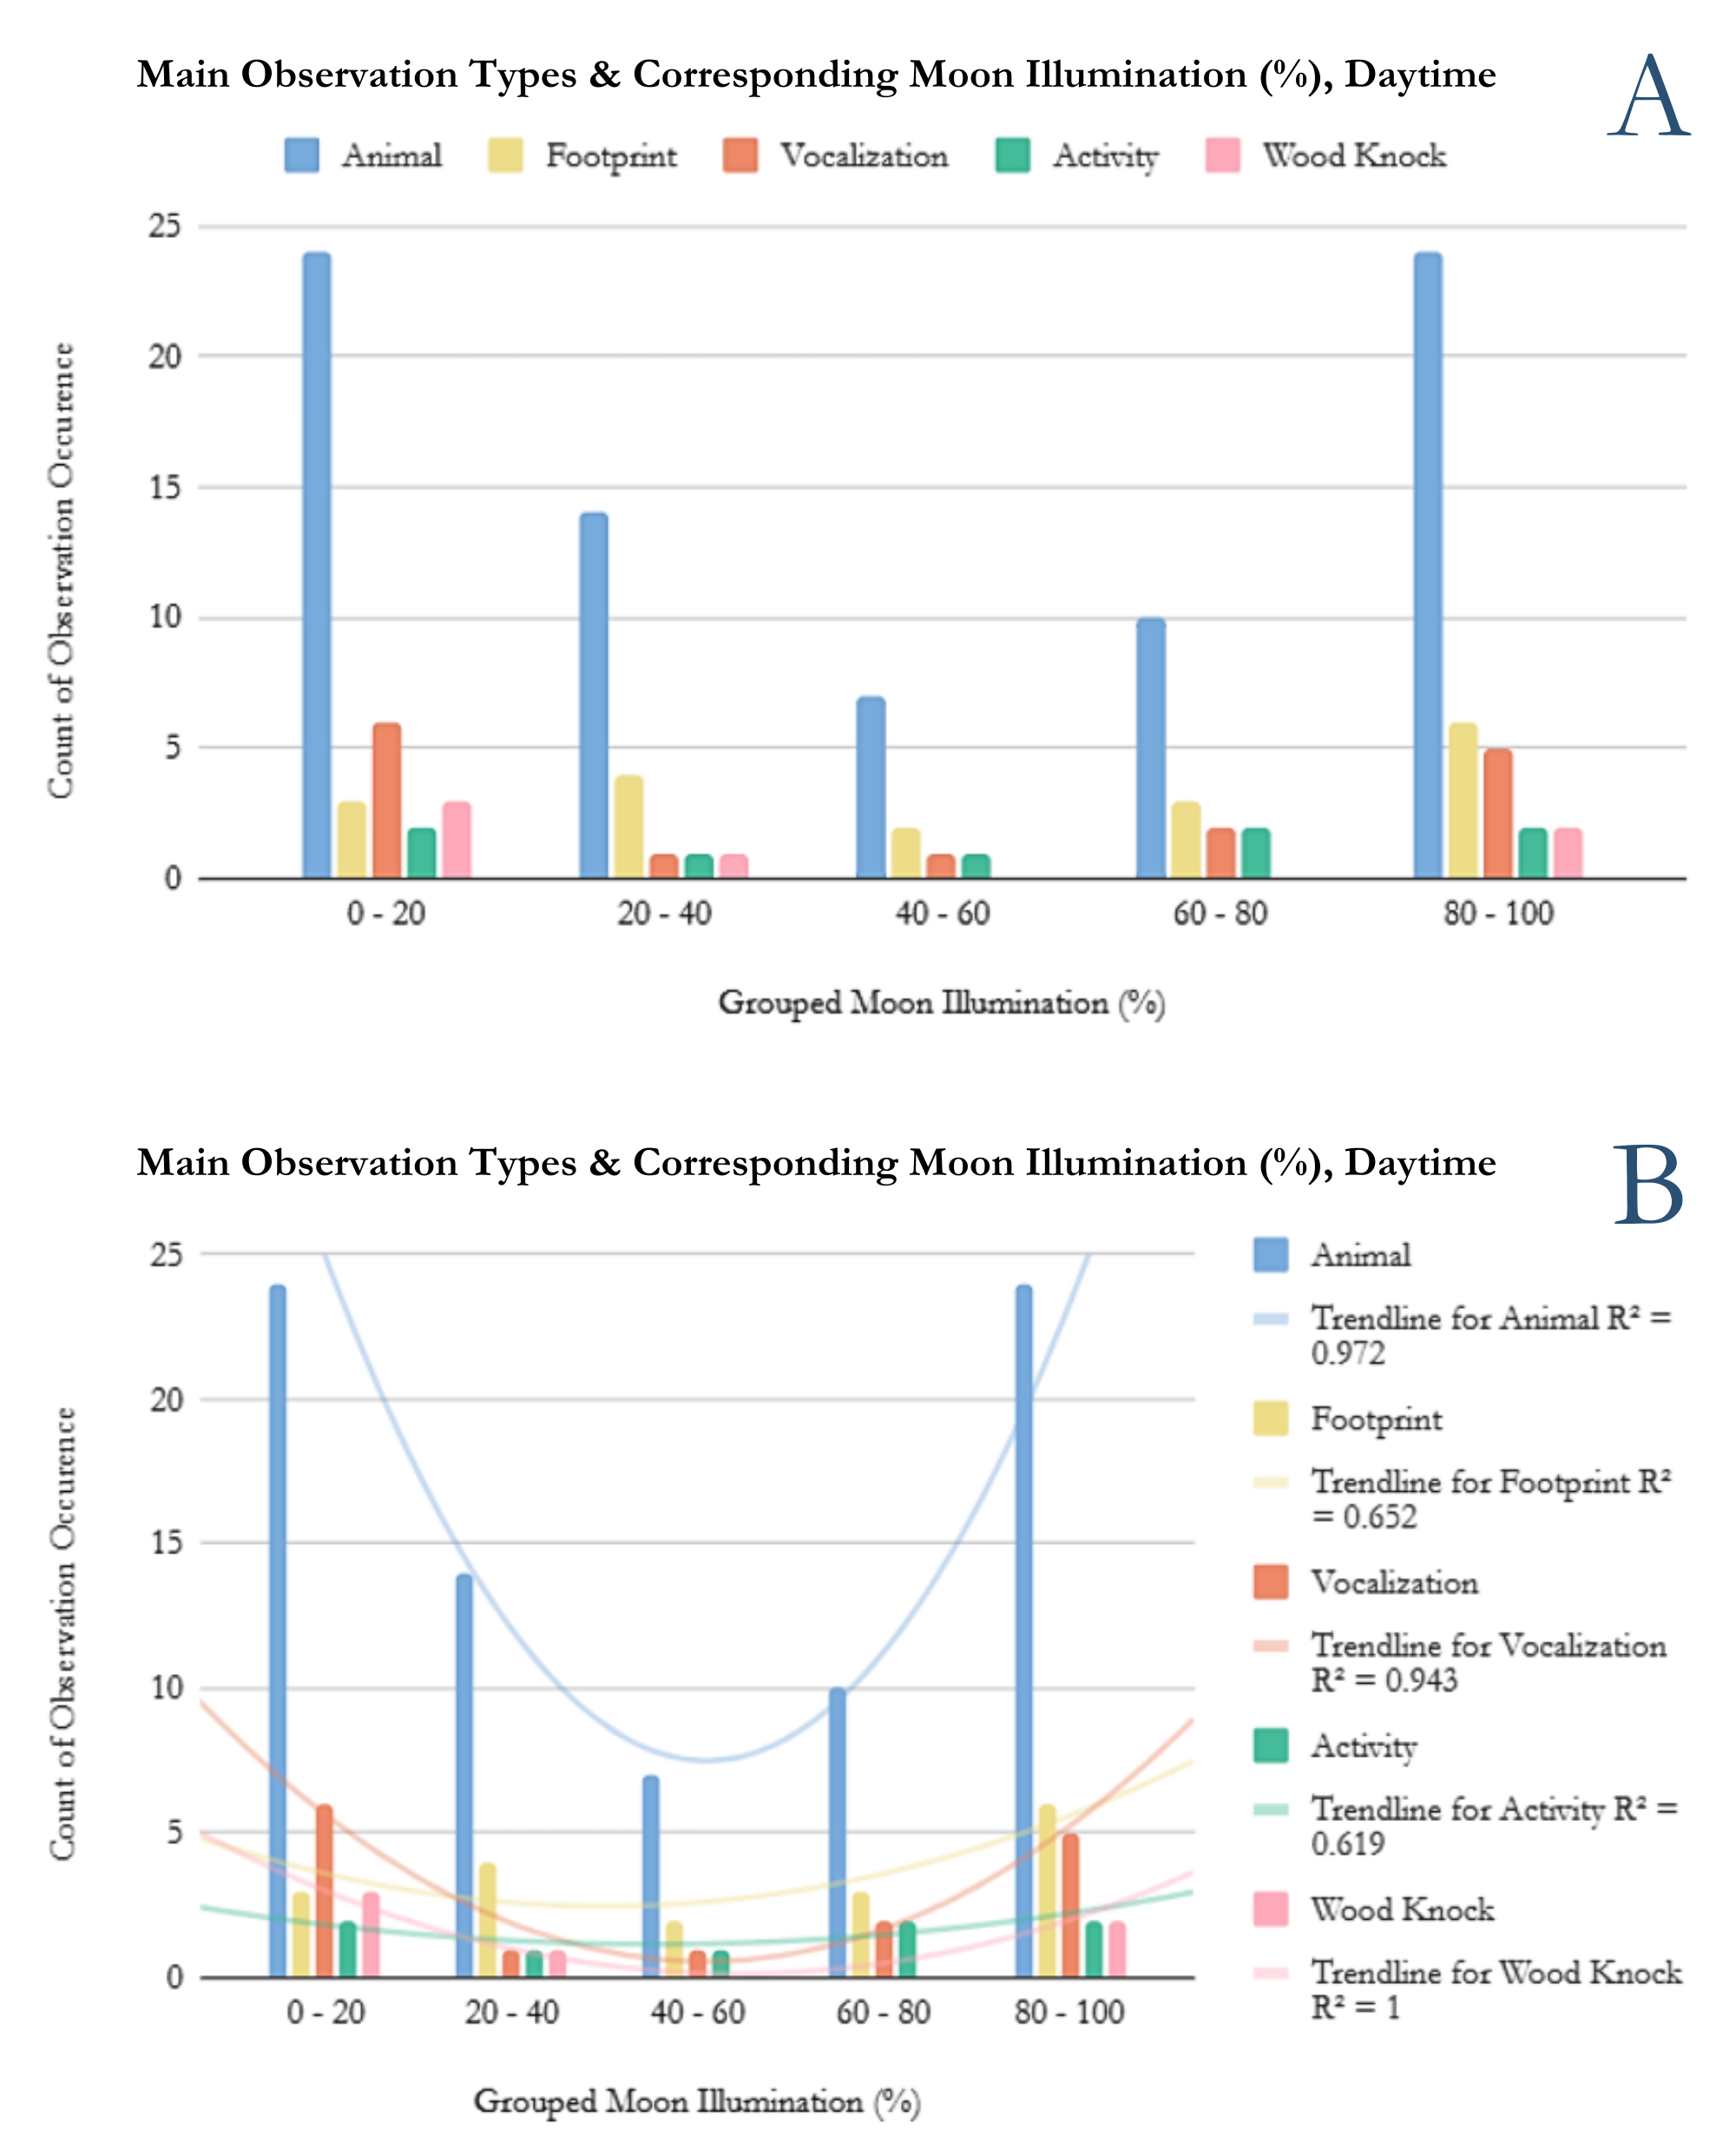
Figure 3. Counts of Main Observation Types and their corresponding moon illumination percentages for times 6:00AM to 8:00PM.
Figure 3 includes the 125 reports of observation occurrences with moon illumination values during the daytime. The daytime timeframe is defined as 6:00AM to 8:00 PM. In this case, reports explicitly stating 8:00PM and beyond are not included. Figure 3 greatly follows the general trend of Figure 1 for the animal sightings category. The biggest differences between Figure 1 and 3 being the stark decrease in vocalizations for both the 0-20% and 80-100% groups.
For this subset of data, R^2 values are 0.972, 0.943, and 0.619 for the “Animal”, “Vocalization”, and “Activity” observation types, respectively. While the “Animal” and “Vocalization” categories remain very strong, “Activity” waivers. The model does not describe the “Activity” data as well, yet could still be regarded as acceptable as more data is collected.

Figure 4. A bar chart representing the different eye shine colors reported in visual sightings from times 8:00PM to 6:00AM.
Figure 4 depicts the range of eye shine colors, if present at all, from the 19 visual sighting reports that occurred between 8PM and 6AM and stated the tapetal reflex (eye shine) color. Of these 19 sightings, 14 reports mention noticing eye shine, while 5 reported its absence. Eye shine colors that have been reported are red, yellow, white, green, yellow-green, orange, and gold. It could be argued that yellow and gold could be combined into the same group, as well as green and yellow-green, but for now they will remain separate categories.
Discussion
There is a clear correlation between moon illumination and sasquatch activity with the current dataset. The preliminary results to be discussed should be taken as just that, preliminary. The point of this blog is to show what the data currently suggest, and to learn how models change as more data becomes available. That said, there is sufficient data to begin looking into potential trends and identifying points of interest within sasquatch behavior.
It is obvious from the data collected thus far that sasquatch encounters are commonly occurring during low (0-20%) and high (80-100%) moon illumination regardless of time of day. This in itself is particularly interesting in that even when the moon is not the prominent light source (i.e. daytime) its influence holds strong during these phases. Evaluating why sasquatches seem more active during the extremes is going to be purely based on speculation and the habits of scientifically recognized nocturnal predators.
Beginning with the nighttime data, all three main Observation Type categories, “Animal”, “Vocalization”, and “Activity”, reached their maximums under high moon illumination (80-100%). The increase in sasquatch sightings under these conditions can probably be attributed to a few factors. First and foremost, humans can see the best under high moon illumination. Ultimately, a human must observe and then report a sasquatch to “officially” have a sighting. Consequently, more reports would come in under these conditions since humans lack night vision and rely on the moon’s light at night to aid our vision.
The specific reasons as to why sasquatches would be more active during times of high moon illumination require a look into known predator-prey relationships. Nocturnal predators tend to use the increased visibility of high moon illumination nights to both patrol their territory and hunt. Prey rely on both direct (predator sightings, scat, moonlight, etc.) and indirect cues to assess predation risk, significantly influencing their nocturnal activity levels (Nersesian, Banks, & McArthur 2011). Increased predation risk during nights with higher moon illumination has caused some species of prey to reduce activities by 40-70% in an effort to increase their chances of survival (Taylor et al., 2023). Predator-prey relationships are extremely complex, and details vary among species, but the general decrease in activity remains true for many prey mammals. Nocturnal predators are also known to patrol their territory during periods of high moon illumination as the decrease in prey activity makes hunting a more energy taxing activity. Coyotes, gray wolves, and mountain lions are just a few of the large nocturnal predators in North America that exhibit this behavior. Nocturnal predators are also known to exhibit more frequent vocalizations to aid in claiming territory and signal to others of their kind during a hunt. Figure 2 details an increase in reported sasquatch vocalizations during both high and low moonlight nights, tentatively supporting this idea. With the current data at hand, the types of encounters in conjunction with high moon illumination can currently be explained by known predator behavior.
Under low (0-20%) moon illumination conditions, sightings of sasquatches decrease compared to the high moon illumination reports but are still prominent compared to the entirety of the dataset. This is potentially partly due to a human’s inability to see as well in darker conditions. If a human cannot see, a sighting cannot happen even if the animal is in close proximity. The decrease in sightings does not necessarily mean sasquatches are not as active with low moon illumination as seen with the numerous reports of vocalizations during these periods. Low light could cause sasquatches to rely more on their voices to communicate with one another, or could be used to signal different stages of a hunt as seen in chimpanzees (Mine et al. 2022). Low light conditions make for the perfect hunting conditions, due to prey perceiving less of a predation risk under these conditions (Taylor et al. 2023). Great apes also vocalize while hunting to ward off other predators in the area and intimidate prey. Various factors, including those not mentioned, could contribute to the increase in vocalizations from sasquatches during periods of low moon illumination.
Even when moon illumination would not influence visual quality (i.e. the daytime), sasquatch activity continues to follow the same general trend of peaks during times of high and low moonlight (Figure 3). This could potentially point to sasquatches having a more dynamic and flexible circadian rhythm over a simple day-night pattern. This could also be an adaptation to the lunar cycles of certain prey species and to avoid competition with other predators like black bears, mountain lions, and coyotes. Additionally, sasquatches are reported to be massive animals. They likely require an enormous caloric intake each day to sustain themselves. For example, a typical gorilla consumes approximately 4,000 calories a day. Orangutans eat around 3,000 calories a day, but will consume upwards of 8,500 when certain foods, like fruit, are plentiful (Knott 1997). Therefore, it is not outlandish to assume sasquatches would also require a similar caloric intake, and probably more, due to their massive, muscular size. Potentially, this alone could make it necessary for sasquatches to hunt day and night. If these preliminary findings hold true as more data is parsed, is it even fair to call sasquatch a nocturnal animal? Currently it is too early to say conclusively, but it is an intriguing question to pose. If this trend of daytime activity increases during low and high moon illumination periods continues, this could point to sasquatches as having highly complex and flexible behavioral tendencies that do not fit into the traditional mold of diurnal or nocturnal.
A shift in perception of the potential circadian rhythm of sasquatches could be biologically plausible. Great apes are not considered nocturnal animals, though approximately 69% of mammals are (Bennie et al. 2014). Particular chimpanzee groups have been noted as adopting nocturnal tendencies to adapt better to their environment (Tagg et al. 2018), but there are no true nocturnal great apes currently recognized by science. Because of the diurnal nature of great apes, they also lack the presence of a tapetum lucidum, a layer of tissue on the eye that aids sight in low light conditions. The tapetum lucidum is made apparent to the observer by the presence of “eye shine” from the animal. Eye shine appears as an array of colors dependent on the host species. These variations can be caused by different compositions, blood vessels, age, structure, and light source (Ollivier 2004), but individuals within the same species typically have the same color tapetum reflex (eye shine). As stated earlier, sasquatches do not appear to be strictly nocturnal animals, though this does not explain why a number of witnesses have noted an apparent presence of eye shine in certain sighting situations. Eye shine color distributions reported by sasquatch witnesses and their counts can be seen in Figure 4. It is important to note there are witnesses who did not notice eye shine when they theoretically should have, such as seeing a sasquatch’s eyes in their headlights. If sasquatches are adapting their habits to fit their environments and are not necessarily following strict diurnal or nocturnal behaviors, it is not unreasonable to think potentially, and I say this with extreme caution, that some genetically similar groups in particular areas have evolved to have eye shine, while others did not to fit their immediate environmental niches. While in theory this could happen, the evolution of the tapetum lucidum is quite complex and involves multiple genes to be present. For vertebrates, there are two main types of the tapetum lucidum, with mammals exclusively having the choroidal tapetum. The different types of tapetum lucidum evolved independently of one another yet their structure and function are remarkably similar (Schwab et al. 2002). That said, no great apes possess a tapetum lucidum, and the necessary genes were probably lost in a previous common ancestor. Though lost for most primates, the tapetal reflex did re-evolve in certain nocturnal primates like tarsiers. It is possible sasquatches could have done the same, and is an example of convergent evolution (Schwab et al. 2002). Reports noting an apparent lack of a tapetal reflex could also be explained by the idea that the species as a whole does indeed possess tapetum lucidum, but certain groups or individuals may not have as intense eye shine due to a number of potential factors including viewing angle of the light, stress, age, or any other number of reasons.
Conclusion
The current data suggests a close correlation between moon illumination and sasquatch activity. Whether these trends are due to humanistic habits or the potentially complex circadian rhythms of sasquatches, it is unclear for the time being until more data is parsed.
If you have any questions or nice comments, please feel free to leave them here! You can also reach me by email or the Contact form on this website.

A Statistical Exploration of Estimated Sasquatch Heights

Introduction
The towering presence of a sasquatch is often the highlight of a witness’s recount. The sheer mass of the creature is enough to raise goosebumps on one’s arms and bring witnesses to tears when sharing their experience. While we cannot take a measuring stick to a sasquatch for an accurate gauge on height, the best we can do is to rely on witness testimony. The Sasquatch Data Project has now parsed 592 reports from the BFRO’s (Bigfoot Field Researchers Organization) online database to bring you and scientists an open-source dataset optimized for coding and data analysis. Of these 592 reports, 311 of them have been “Class A” visual sightings of the animal. If you are not familiar with the term “Class A”, it means without a doubt the person saw a sasquatch. Of those 311, 211 reports mention at least one height of a sasquatch. In today’s blog we will be exploring the various heights of sasquatch and how this data can potentially allow us to learn more about their social dynamics. We will investigate sightings where only one sasquatch was seen and also those with multiple.
Sources of Error
Before diving in, I think it is important to go ahead and point out potential sources of error within this data. The first major place for error is a person’s inability to correctly gauge height, especially when afraid. This psychological phenomenon is called “visual magnification”. Stefanucci & Proffitt (2009) found that individuals estimating height while looking up from the ground overestimated the vertical height of a distance by up to 26-29%. It is important to note the subjects were not faced with fear in that portion of the experiment, suggesting people have a general tendency to overestimate heights larger than they are. Steffanuchi & Proffitt also found subjects experiencing fear and anxiety during the experiment perceived a size up to 31% larger, albeit while looking down from a point and judging the distance. Though much research has not been done on this specific phenomenon, this study should be kept in mind when considering the heights of sasquatches in these reports. For many people, seeing a sasquatch is an extremely unnerving experience. It is reasonable to assume there would be some level of error in height perception due to this.
Another source of error on my part lies in that sasquatches likely have height differences as a sexually dimorphic trait. This is seen in the other great apes and humans. In statistical analysis it would be more correct to separate out the heights based on the sex of the sasquatch in addition to their age. Currently, we are unable to do that with the data at hand. There are not enough reports specifically noting genitalia or secondary sex characteristics to do this. This will be discussed further in the blog, but I assume any height over 6ft to be an adult, and anything under, a juvenile. This idea introduces error into the analysis. With that out of the way, let’s get into the data.
Sightings of One Sasquatch & Their Estimated Heights
Data
To begin this investigation, let’s first look at sightings in which only one sasquatch was seen. Using Python, I filtered out only accounts detailing one sasquatch and provided a height for the individual. Out of the 289 reports of one sasquatch, 211 of those provided a height estimate. I then created a histogram to visualize the frequency distribution of heights (Figure 1). Histograms are a quick and easy way to get an idea of the distribution and shape of the data.

Figure 1. A histogram depicting the heights of sasquatches from sightings when one individual was seen.
Made obvious by Figure 1, the most reported height lies between 7 and 7.9 feet. The second largest bin includes heights from 8-8.9 feet.
Figure 2 depicts a box and whisker plot for the height of sightings with one sasquatch. Table 1 relays values for Figure 2.

Figure 2. A box and whisker plot for sasquatch heights from sightings with one sasquatch.
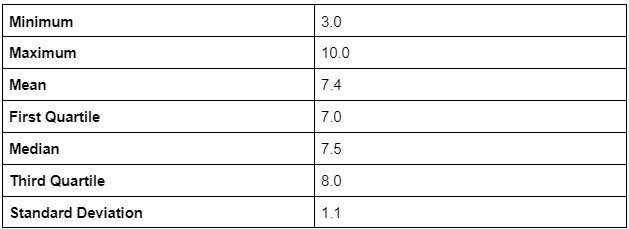
Table 1. Statistical values for Figure 2. Units in feet.
Box plots are a great next step for getting an initial look at how the data is spread. The y-axis (vertical axis) holds the height in feet of the individual. The x-axis (horizontal axis) labels the individual sasquatch in the sighting with the corresponding data. This will become extremely important later when we look at sightings with multiple sasquatches. For now, the reports only include one individual, so we are only investigating “Individual 1”.
To read a box plot, let’s start from the outside and work our way in. The circles sitting outside the main plot in Figure 2 designate outliers in the data. Outliers are data points that lie an abnormal distance from other data points in the sample. They can represent mistakes, variability, and rare occurrences. In our case, the data points at [3, 3.5, 4.5, 4.75, 5, 5.25, 10] are outliers and probably represent juveniles and very large males (or a case of visual magnification). So out of the 211 reports of single sasquatch sightings with heights associated with them, those values were abnormal compared to the others.
The short lines outside of the main box, or the tails, represent the minimum and maximum values in the data set that are not outliers. These are the highest and lowest values within a “normal” distance from the other data points.
Working our way in, the line that creates the bottom and top sides of the box are called the lower and upper quartiles, respectively. They are also called the first and third quartiles, or Q1 and Q3. The lower quartile is found by arranging the data in ascending order and finding the data point where 25% of the data is less than that value. The upper quartile is found in a similar fashion, but is the value where 75% of the data is less than that value.
The entire box itself is called the Interquartile Range, or IQR, and describes the spread of the middle half of the data or distribution. The IQR is a useful tool in finding outliers and it gives you a good look at how spread out the middle 50% of your data is.
The green line represents the median of the dataset. The median is the value exactly in the middle of all the data if you arranged it in ascending order. It is where 50% of the data is less than that value, and 50% is greater than. This is different from the mean (designated by the green triangle), or the average, which tells us the value if you added all the data points then divided by the number of data points. We can learn a lot about a data set by comparing the median and the mean, which we will touch upon shortly.
Discussion
Based on witness testimony, adult sasquatches do not typically exceed 9 feet tall. Claims of heights exceeding 9 feet are outliers, as seen in Figure 2, and may be attributed to the visual magnification phenomenon described earlier in this article. On the flip side, it is possible certain individual sasquatches could reach and exceed this height due to genetic diversity, climate, or resource availability. The average height of an adult male human is 5’9, but there are people who exceed 7 feet tall. It is not out of the realm of possibility that sasquatches could grow beyond 9 feet, but it seems more rare as things stand (pun intended) right now. As stated earlier, I consider any height over 6 feet to be an adult sasquatch while acknowledging the error in this logic. Height-based sexual dimorphism, or height dimorphism, is likely to be present in this species as it is seen in other apes and humans. A “teenage” male sasquatch could potentially be in the height range of an adult female sasquatch. For example, the Patterson-Gimlin film subject “Patty” is estimated to be in the range of 6’4. She is thought to be an adult female sasquatch showing enlarged breasts and a muscular, mature stature. Male sasquatches exceeding 7 feet tall have to grow to that height someway, though, so it only makes sense some of the sasquatches seen in the 6 foot range would be adolescent males and not adult females. I acknowledge this potential source of error and how it may skew the data. Nonetheless, I will proceed with my current assumption that adult sasquatches can be described as any individual over 6 feet tall.
When data has a mean that is less than the median, in this case 7.4 and 7.5 respectively, it suggests the data is slightly skewed to the left. This also suggests most of the outliers lie on the smaller end of the spectrum, and is evident by visually looking at the plot. A left skew indicates smaller values are less likely than larger values in this particular dataset. The opposite would be true if the data was skewed to the right. Figure 1 visually demonstrates this concept well. The “tail” of the histogram is on the left of the plot while the bulk of the data is on the right. Therefore it is skewed left. The idea that smaller sasquatches are less likely to be seen on their own makes sense from a biological standpoint. Filial attachment between great ape mothers and juveniles describes the strong emotional bond juveniles have towards their mothers. They seek out the presence of their mother for both emotional and physical care. Chimpanzees and bonobos exhibit more independence from a younger age than gorillas or orangutans, but their lone escapades are only for short periods of time and the mother is typically still watching them. On the contrary, orangutan juveniles will stay within close proximity of their mother until they are a few years old. Assuming sasquatch juveniles show a similar level of dependence, it is not surprising the majority of single sasquatch sightings are of larger, older individuals. Socially among great apes, adults are the ones foraging, hunting, and scoping out new areas to live. They will stray from the group in search of resources, and we can assume the same is happening with sasquatches based on this data.
Moving forward, the spread of the IQR as seen in Figure 2 is relatively small. This will be readily apparent when compared to the dataset that includes sightings with multiple sasquatches. A small IQR indicates the data is clustered around the median, which can also be seen and supported by Figure 1. This feature can suggest a high level of consistency and precision within the data, but that is not likely in our case. Consistency is possible, precision is absolutely not in my opinion. This data is based on eyewitness testimony, not a physical measurement, therefore the data is not precise. We can assume most witnesses are not highly trained in judging heights and distances. We must also acknowledge that the height range of 7-8 feet has been thrown around as “common knowledge” for sasquatches for decades, therefore witnesses may have preconceived notions of what they think they “should” be seeing when they see a sasquatch, therefore defaulting to that range when relaying how large it was. In a future investigation, I am going to be investigating the purported heights of sasquatches pre and post internet to see if there is any significant difference in the heights reported. If witnesses are indeed defaulting to the “expected” height of a sasquatches, I do not think it is intentional, we must accept this as a source for error. Height distortion could also be a source of error. A person could be seeing a 6-6.5’ sasquatch but due to its muscular body build and emotional fear, a taller size could be perceived. Therefore the data is not precise. But that does not mean it cannot be consistent. If the sasquatch is much taller than a typical human (5’9 for males and 5’4 for females), but not monstrously tall, a height of 7-8 feet is not out of reach. So for this study we have to focus on the consistency aspect of the data and what it could potentially tell us about sightings with one sasquatch.
Sightings of Multiple Sasquatches and Their Estimated Heights
Data
Instances of multiple sasquatches being seen is quite rare. Out of the 311 sighting reports, 9 of them mention 2 sasquatches, and 2 report a group of 3. Obviously, we are seriously lacking data, but every investigation has to start somewhere. With such a small sample, I’ve skipped a histogram and gone straight to a box plot, Figure 3. The y-axis is the height in feet and the x-axis indicates which individual sasquatch the heights are for. In my dataset, Individual 1 is always the tallest sasquatch. Individual 2 is the second tallest, and Individual 3 is the smallest. Because only 2 reports mention 3 sasquatches, I will be focusing on the 9 reports that mention 2. But for transparency’s sake, I’ve gone ahead and plotted the 2 reports of 3 sasquatches and their heights.

Figure 3. Box and whisker plot of estimated heights of sasquatches where multiple individuals are seen.

Table 2. A table detailing the values associated with the box plot.
Individual 1 and 2’s mean is less than its median, meaning the data is skewed left. Since Individual 3 only includes 2 data points, I am not going to make any assumptions on the data.
Figure 4 compares the heights of the sasquatches within each individual sighting. The height of “Individual 1” in feet is listed on the x-axis, and the height of “Individual 2” in feet is noted on the y-axis. Sightings of an assumed adult (>=6ft) and juvenile (<6 ft) are denoted with yellow circles, green circles indicate 2 adults, and purple circles label 2 juveniles. It is important to note that two sightings reported seeing two sasquatches both of 5.5 feet tall. So there are two data points overlapping at that intersection on the plot.
Three reports indicated Individual 1’s height was greater than or equal to 6ft and Individual 2’s height was less than 6 ft. There were also 2 reports claiming both Individual 1 & 2’s heights were less than 6 feet. Lastly, 4 reports noted that both Individual 1 & 2 stood taller than 6 feet

Figure 4. Comparing heights of sasquatches when multiple are seen in one sighting. Yellow circles denote an adult and juvenile, green circles indicate 2 adults, and purple labels 2 juveniles.
Discussion
With so little data pertaining to sightings of multiple sasquatches, there is only so much that can (and should) be said. The first bit of information that jumps out at me is the difference in heights between Individual 1 & 2. Both the mean and median for Individual 1 are over 6 feet while the opposite is true for Individual 2. In my opinion, this points to an adult sasquatch being with a juvenile. It is also interesting to note the average height is on the suspected “smaller” side of the adult height spectrum coming in at 6.5 feet and the median is sitting at 7.0. This could potentially suggest female adults are more likely to be traveling with juveniles over an adult male. As discussed previously, it is likely sasquatches also exhibit filial attachment between mother and offspring, and so far the data suggests this is the case.
Additionally, in every report in which multiple juveniles are traveling together, one of them is over five feet tall, suggesting they are possibly past childhood and into adolescence. If this trend continues as more data is collected, it seems older juveniles have some level of independence and responsibility for their younger counterparts.
Sightings reporting two adults do not give us any insight into which sexes travel together and in what frequency, therefore we will just leave it at that until I can get through more reports.
Conclusion
Sasquatch heights are more than just a number. Once more data is obtained we can dive deeper into what their size might indicate about their evolution, social structures, and ecological role. Something I have realized through years of independent research into sasquatch is that we as a community make a lot of assumptions without actual data to back it up. No one can tell you numbers as to why something is or isn’t the case, it is mostly opinion based on personal experience. Part of my mission with the Sasquatch Data Project is to provide that data. While many of the findings so far seem intuitive, in science we have to have the numbers to back up claims. I am really excited to be doing that for this field and can’t wait to watch the numbers evolve and start performing statistical analysis once I get through more reports. I hope you enjoyed this blog and found bits of it interesting. I will continue to expand upon this area of research as I get through more reports. If you have any questions or (positive) comments, please feel free to leave them under this blog or email me!

USA Sasquatch Reports Update 3/18/24
The Sasquatch Data Project is 400+ reports deep into organizing all the BFRO reports into one dataset that can be used by anyone to perform scientific/mathematical analysis on. I just finished up the Oregon reports and have begun parsing the North Carolina data. Here’s a lil Part 1 update on how things are looking so far.
The Sasquatch Data Project is 400+ reports deep into organizing all the BFRO reports into one dataset that can be used by anyone to perform scientific/mathematical analysis on. I just finished up the Oregon reports and have begun parsing the North Carolina data. Here’s a lil Part 1 update on how things are looking so far.
It’s important to note the data presented here is ONLY looking at “Class A” visual sightings of sasquatch(s). These results do not include “Class B” reports (vocalizations, footprints, wood knocks, etc). Also, you’ll notice the numbers don’t always add up to 213, the current number of visual bigfoot sightings. This is due to the report not containing the data, therefore it is null. Alright, let’s dive in!

So far the top types of encounters include “At Distance” (the sasquatch was seen at a distance by the witness either for the entire encounter OR initially) with 60 reports, “Observing the Witness” (the sasquatch was initially noticed by the witness as the sasquatch was observing her/him) with 47 reports, “Road Crossing” (the witness saw the sasquatch crossing a roadway) with 45 reports, and a tie for 4th place, each having 16 reports, “Standing On Road” (the sasquatch was seen standing on the road or very close to it (<5 ft)) and “Residential” (the sasquatch was seen in close proximity to someone’s residence). The good news is, you’ll most likely see the sasquatch before it sees you. The bad news is, all the data is not in yet and the roles may reverse. Keep that in mind next time you’re in the woods alone 👀 In all seriousness though, it’s worth noting that encounters on or near a road actually outnumber the current leader, “At Distance”. There’s a number of reasons why this might be the case. Potentially, it’s just a numbers game. It can be inferred that there are more people who travel on the roadways over being in an environment where sasquatch might be living (hiking, camping, mushroom hunting, etc). Another reason might be that the roads give sasquatches a relatively clutter-free way to travel, therefore they might use them more frequently, increasing the probability of being seen. Or something entirely different. It’s not clear yet, just some food for thought.

When it comes to the “best” time to have an encounter, fall is barely in the lead with 77 reports, but summer is close behind with 75. Winter and spring are trailing with 30 reports each. These numbers DO NOT necessarily mean your chances of seeing a sasquatch during the fall or summer are more than spring or winter. A number of factors could influence this. One of which being that more people are typically hiking/in the woods during those seasons because of the nice weather. Therefore, more sasquatches would be seen. These current results might also be dependent on your geographic location as well. For example, in Oregon the majority of sightings happened in the summer, 48 to be exact. Whereas in Alabama, the top season for a sighting was fall with 23 reports. Once all the data is in, it will be interesting to split this category up regionally and begin thinking about influential factors. For now, we can only speculate.
Studying the moon illumination statistics over time will be one of my favorite parts about compiling this dataset. I often hear bigfoot researchers say sasquatches are more active with a brighter moon, but they do not have the actual data to back it up. It’s just words at this point. So far though, the data does lean this way. Even though the average percent of illumination is 60%, 51% of Class A sightings have happened when the moon was 80% or more illuminated. Only 21% have occurred when the moon was 20% illuminated or less. There might be an explanation for this that does not involve the activity of sasquatch, though. Obviously, you have to actually see a bigfoot to have a sighting. Humans need light in our visible spectrum to see. Therefore, a brighter moon would make it much easier for a human to see a bigfoot. This definitely is a factor in these percentages, but once I go through more data I can perform statistical analysis to calculate a correlation coefficient between high and low moon illumination to sasquatch sightings.

Moving on to the physical attributes of sasquatches, the average height, weight, and shoulder width were not surprising to me and I think need little explanation. Something the average does not describe, though, is the differing heights of sasquatches in sightings where multiple bigfoots are seen. This is going to be the topic of a future blog that I’m really excited to share. The body build is described as being overall muscular. A “V-shape” could also fit under this category, but enough witnesses have specifically described this body type I wanted to designate it as its own category. Then we have reports that specifically called out a sex of the animal. It is important to note that I have only included reports where either gentalia or breasts were seen. I did not include reports where the witnessed assumed a sex based on looks or “vibe” they got from the animal. Only having 7 reports to go off of, not much can be said as things stand now.
Something that stood out to me instantly was the 50/50 split on the head shape. The head shape seems to be a hot topic within the bigfoot community, so I’m excited to see how these numbers evolve over time. Most reports did not note the shape of the head. Is this because it resembled a more “human” shape (rounded) so it did not stand out as being noteworthy or odd to the witness? Or maybe in the shock of the moment that was the absolute last thing on their mind (probable). Not sure, but this is what we have to work with. 30 reports. I’m interested to see if this trait varies regionally and how that might correlate to potential food sources in that area. The proposed sagittal crest that creates the conical head shape is typically seen in apes consuming things like root matter, sticks, and tough vegetative materials. They need very strong muscles to chew such coarse foods. Would the differing diet of sasquatches in various regions of the country influence the shape of their skull? One study found that a sagittal crest is also associated as a sexually dimorphic trait in apes. Balolia et. al found that 93% of G. g. gorilla males had a sagittal crest, while only 58% of females had one. They also found the size of the sagittal crest was dependent on age. Younger apes had smaller sagittal crests. It’s unclear at the moment how this relates to sasquatch, but it is worth keeping in mind. This does NOT mean we can assume the sex or age of the sasquatch based on whether or not it has a conical shaped head. Again, this is just information to keep in mind but not influence our perception of sightings and make assumptions.

Posture is another trait that is of particular interest to me. A total of 29 reports mentioned either a “hunched” or “stooped” posture while the animal was moving bipedally. I am interested in how this ties into arm length. The more lean in the stance, the longer the arms are going to appear while in a bipedal position. So, are the arms actually reaching to the knees or is it just how the animal is standing? Long arms are often reported by sasquatch witnesses, which would make sense since they have been reported on occasion (twice so far in my investigation) to move quadrupedally. My thinking is that the arm length is probably longer in respect to their height than what we would expect of a human, but is exaggerated by the stooped posture.
The nose shape has mostly (I use that word lightly) been described as “flat”. This does not mean flat like a gorilla which lacks a protruding nose. This descriptor is more like that of a human with a flat nose. It is interesting that every report that describes the nose says it is human-like as opposed to something you might see on a gorilla or orangutan.
A foul smell during a sasquatch encounter is another trait that is often talked about within the bigfoot community, but does not appear to be as common as one might think. So far, only 11% of reports mention a foul smell. To be fair, though, as we learned earlier most of the reports are encountering the sasquatch at a distance, so if there was a smell being produced by the animal, it might be too far aware for that to carry to the human. A more useful statistic would be to look at only close encounters and calculate a percentage. When I add more data to the spreadsheet I will look at that.
Another topic of debate is the supposed “eye shine” sasquatches are reported to have. Personally, I do not think they possess eye shine, but I also have no explanation for what people are seeing. The top color for eye shine is white with a resounding 3 (!!!) reports. One road crossing sighting from a semi-truck driver in Oregon specifically noted that eye shine was not present. Obviously, none of this is compelling one way or the other. Eight reports noting eye shine out of the 200+ sightings are not nearly enough data to make any assumptions or guide our insights into this phenomenon.
The lack of a prominent neck is another physical trait that has become a classic sasquatch descriptor. The complete lack of neck vertebrae seems highly unlikely to me, but the data so far does suggest (again, I use this phrase lightly) that the neck is significantly shorter than a human’s. Out of 20 reports that mentioned this, 16 noted there was “no neck”. In cases where a neck was mentioned, they described it as being very short. I have yet to come across a report where the witness claimed the neck was as long as a human’s.

Moving on to skin and hair color, and hair length, the skin color is typically described as “dark”, black, or grey with a leathery or oily appearance. It is mostly likened to that of a gorilla in the reports, but it varies on how the witness describes the color. The most reported hair color is, slightly surprisingly, dark brown, only beating out black by one report. “Generally dark” is another popular descriptor. I assume this includes either dark brown or black but the lighting conditions were lacking and a specific color could not be observed. With all this in mind, sasquatches are typically seen having darker hair colors so they are not surprising results. There are exceptions, though. In Alabama, multiple sightings of white and blonde sasquatches were reported within a particular region. Could it have been the same sasquatch? Or maybe there is a genetic line in that area that produces blonde bigfoots. It is interesting that this color was reported by different individuals at different times, lending to the credibility of the sightings.
Last but not least, it was found that the average hair length is 5.3 inches so far. There were not many reports to contribute to this average, so this result should be taken with a grain of salt.
Though the project is well into sorting through all the reports, in the world of science and data analysis, we are nowhere near the point of having enough data to make any assumptions, let alone firm statements on any of the suspected traits of sasquatch. With more time, and data, we will get there though! If anything, this investigation allows us to display just how prevalent bigfoot activity is in general. Also, my goal is to help other sasquatch researchers, especially those who follow up with witnesses, get ideas on questions they should be asking and details to look for while conducting investigations. One of the things that has stood out to me while going through the reports is how little information is gotten from the witnesses about the sasquatch itself. There is a ton of information regarding the setting and circumstances surrounding the sighting, but surprisingly little information on the physical and behavioral traits of the animal. I’m currently putting together a resource that will hopefully help investigators derive as much data from their witness interviews as possible. As citizen scientists, we need to constantly be looking for ways to improve our investigative methods! It’s critical to the subject as a whole, and plus it’s fun to learn something new.
If you have any questions, feel free to leave them in the comments. Or, if you’d like to submit a sighting report, go to “Contact” and fill out the form!