
Beyond Random Chance: Multivariate Analysis of Sasquatch Witness Reports with Lunar, Seasonal, And Psychological Data
Abstract
Historically, reports of alleged sasquatch encounters have been evaluated through qualitative means rather than rigorous statistical analysis. This study analyzed 191 Class ‘A’ sighting reports from a dataset of 776 Class A reports across 17 states, 63 years, and are limited to the South and West regions of the United States. Data were parsed from the Bigfoot Field Researchers Organization and North American Wood Ape Conservancy’s databases of sasquatch witness reports. Three key variables were examined to calculate the probability the patterns that emerged were due to random occurrence. These variables were lunar illumination during encounters, seasonal distribution, and the relationship between witness fear level and reported sasquatch height estimates. Analysis unveiled significant non-random patterns in all three variables. Cycle-corrected moon illumination showed a bimodal distribution with peaks during upper-middle (50-75%) and near-full moon (75-100%) illumination conditions (χ² = 8.717, p = 0.033). Seasonal analysis displayed a predominance of fall and summer encounters (χ² = 21.426, p < 1 × 10⁻4). A significant positive correlation was uncovered between witness fear levels and reported sasquatch heights (r = 0.219, p = 0.0030), with reported average heights increasing from 6.8 ft (SD = 1.5) in mild fear cases to 7.7 ft (SD = 0.9) in extreme fear cases. Combined probability analysis utilizing Fisher's method produced odds of 1:98,348 against these patterns occurring by chance. These patterns align with known wildlife behavior and human psychological stress responses, suggesting either sophisticated coordination of hoaxes or the capture of consistent underlying phenomena in witness reports that warrants further investigation.
Introduction
Cryptozoological studies have traditionally relied on anecdotal evidence and qualitative analysis, often lacking quantifiable investigations or findings. Quantitative studies and statistical analysis of alleged sasquatch encounters have been extremely limited, and typically focused on the physical traits of reported sasquatches (Fahrenbach, 1997), footprint measurements (Krantz, G.S. 1992; Meldrum, 2007), or geographic dispersion of reports (Daegling, D.J. 2005). The systematic analysis of the behavioral traits, environmental conditions, and psychology of sasquatch witness reports has largely remained unexplored.
Extensive databases of sasquatch witness reports have been maintained by two organizations, the Bigfoot Field Researchers Organization (BFRO) and the North American Wood Ape Conservancy (NAWAC). The reports often contain detailed information pertaining to the behaviors and physical traits of the alleged sasquatch, environmental conditions of the encounter, and emotional state of the witness. Individually, the reports may include biases and misidentifications, but large-scale trend analysis in the datasets could reveal how improbable it is these patterns would occur by random chance or independent fabrication of reports.
Examining independent variables within witness reports can strengthen the statistical validity of a multivariate approach. Of particular interest for this study are season and lunar illumination percentages on the date of the encounter, and witness fear level in relation to the estimated height of the reported sasquatch. Utilizing variables that vary independently and encompass both objective environmental conditions (moon illumination, season) and subjective witness experiences (witness fear, estimated sasquatch height) strengthens the analysis by using features that would be difficult to coordinate across hundreds of individual reports. Further, these variables can be compared to patterns of known North American wildlife, human behaviors, and documented human psychological phenomenon, potentially providing frameworks for interpreting any prominent patterns.
Research Objectives
This study aims to:
Examine sasquatch sighting frequency distributions in relation to lunar illumination conditions.
Analyze seasonal patterns of encounters.
Investigate reported witness fear levels in relation to the estimated height of the alleged sasquatch.
Assess the combined probability of observed patterns being the results of random chance or independent hoaxing.
Though sasquatch reports have been collected for decades, they have rarely been subjected to rigorous statistical analysis. The analytical gap in cryptozoology led to polarized viewpoints, either fully accepting or dismissing anecdotal evidence without systematic evaluation. This study aims to introduce a novel approach to examining sasquatch reports by applying established statistical methods across multiple independent variables, focusing on environmental and psychological factors that would be difficult to coordinate in fabricated reports. Rather than attempting to answer the question of existence of the species directly, this approach evaluates the likelihood all patterns in the data emerged by random chance simultaneously or warrant further investigation.
Methods
Data Selection
An initial dataset of 1495 sasquatch witness reports from the BFRO and NAWAC databases were considered. Analysis was restricted to “Class A” (n = 776) sighting reports, in which the witness claims to have clearly seen an ape of unclassified species in North America. Reports labeled as “Class B” (n = 707) or “C” (n = 10) were not included due to a greater risk of misidentification and possible ambiguity of details. Class B reports are met with more uncertainty and describe reports in which the witness is unsure of what they saw, vocalizations, or alleged footprints. Class C reports pertain to secondhand stories and legends. Class designation was extracted from the original classification from the organizations. By examining Class A reports, the possibility of misidentification is minimized, and only includes reports in which the witness is more certain of what they experienced.
Further, data was limited to the South (n = 385) and West (n = 312) regions of the United States, including a total of 17 states. Geographic restriction was implemented to reduce the likelihood of sampling bias from regions with significantly lower report frequencies (Table 1). This decision was made to ensure robust statistical analysis, as the South and West United States regions are of substantial sample size for this investigation. Including multiple regions with substantially smaller sample sizes could introduce sampling bias and reduce the statistical power of this analysis.
Additionally, the analysis only focuses on reports containing four key variables: Lunar illumination of the encounter, season of the encounter, witness fear level during the encounter, and estimated height of the alleged sasquatch. These variables were chosen for their independence from each other and potential correlation with documented humanistic, ecological, environmental, and psychological phenomena. Only including reports containing information pertaining to all four variables is critical to ensuring an equal sample size and robust combined probability using Fisher’s method. Filtering once more to meet this criteria, our final sample size is 191 reports (Figure 1), spanning from the years 1960 to 2023.
All reports were parsed and labeled using a combination of Large Language Model (Anthropic, 2025; OpenAI, 2025) assistance and manual combing. Reports that did not include all criteria listed above were excluded from the main analysis; however, partially complete reports are explored in the expanded dataset and analysis.
Statistical Analysis
The filtering process reduces the sample size considerably, but the final sample size of 191 reports ensures strong statistical reliability for this analysis. For chi-square tests with degrees of freedom ranging from 1 to 4, our sample size achieves excellent power (1 - β > 0.93) to detect medium effects (w = 0.3) and reaches maximum power to detect large effects (w = 0.5) at α = 0.05. The power to detect small effects (w = 0.1) is limited (0.17-0.29), but this analysis is focused on substantive relationships, therefore this is not of concern. The use of permutation tests and bootstrap analyses supports the robustness of this approach.
To control for multiple comparisons, a False Discovery Rate (FDR) correction was implemented using the Benjamini-Hochberg procedure to maintain balance between Type I error control and statistical power. Using only raw p-values for the combined analysis in a multivariate analysis elevates the risk of false significance, and by implementing FDR correction this risk is greatly reduced. The Benjamini-Hochberg procedure was chosen over stricter methods like Bonferoni due to its ability to control the rate of false positives while maintaining higher statistical power. Additionally, the Benjamini-Hochberg procedure scales with the number of tests, making it appropriate for a multivariate analysis. The false discovery rate is set at 0.1 and the critical value is 0.01 allowing for a balanced approach to reduce false positives, while maintaining the ability to detect meaningful trends in the data.
Statistical testing was performed using Python. Particular libraries used included Pandas, NumPy, SciPy, StatsModels, and MatPlotLib. Power analysis calculations for the chi-square test used the GofChisquarePower module from StatsModels.
Lunar Illumination Analysis
Moon illumination percentages were calculated for encounter dates using the Meeus algorithm (Meeus, 1998). Illumination percentages were then divided into four equal-width bins: 0-25%, 25-50%, 50-75%, and 75-100%. A cycle-correction was applied to account for the nonlinear progression of moon phases and disproportionate time spent in extreme lunar phases. This correction adjusted for the natural lunar cycle time distribution of 33.3% for the 0-25% and 75-100% ranges, and 16.7% in the 25-50 and 50-75% ranges. Without correction, a random distribution of sightings would appear artificially elevated at extreme values. A chi-square test was performed on the cycle-corrected data to determine the probability the observed frequencies arose from chance alone. This analysis was performed using the scipy.stats.chisquare function in Python with a significance threshold of α = 0.05.
Seasonality
Reports were categorized by meteorological season following the National Oceanic and Atmospheric Administration’s (NOAA) standard climate definitions based on the encounter date: Spring (March-May), Summer (June-August), Fall (September-November), and Winter (December-February).
Under the null hypothesis of no variation of frequency due to season, encounters would be expected to be distributed evenly across seasons (25% per season). A chi-square test was performed to assess the probability of the observed frequencies occurring due to chance. A bootstrap analysis with 10,000 iterations was employed to obtain robust and conservative probability estimates. Within each iteration, we randomly sampled with replacement from the original dataset to create a distribution of test statistics. This allowed for confidence intervals estimates to be obtained for the chi-square statistic.
Permutation testing was also performed to further evaluate the likelihood of the observed frequency distribution occurring by chance. This involved randomly reassigning season labels to the reports 10,000 times while maintaining the original sample size, then calculating the proportion of permutations that produced a test statistic equal to or more extreme than our observed value. A Benjamini-Hochberg False Discovery Rate (FDR) correction was then applied with a conservative threshold of 0.01.
Witness Fear Level & Estimated Alleged Sasquatch Height
Witness fear levels during the encounter were categorized based explicitly on the testimony given by the witness themselves. Fear levels were divided into the following four groups:
Mild Fear (n = 14)
Definition: Expression of general unease rather than fear.
Statements include feelings of nervousness, feeling “off”, or elevated awareness.
No physical symptoms.
Example Quote: “...it left us feeling uneasy.”
Moderate Fear (n = 51)
Definition: Clear expression of fear, possibly leading to departure from the scene and potential mild physiological responses.
Statements made by the witnesses include the witness feeling definitively scared.
Example Quote: “...feeling spooked I drove out of there fast.”
Elevated (n = 82)
Definition: Increased fear accompanied by physiological responses (e.g., piloerection, increased heart rate, shaking).
Statements made by the witness include feeling “stunned” and “very scared”.
Example Quote: “It had our hearts beating wildly and the hair standing up on our arms.”
Extreme (n = 44)
Definition: Severe fear with physiological responses and possible lasting behavioral impact.
Witnesses may claim to never partake in the activity that led them to their sighting again (i.e. camping, hiking, fishing, etc.)
Example Quote: “This event traumatized me. I have never been able to go in the woods alone or enjoy camping since this event.”
When witnesses expressed a level of fear or unease that straddled two group’s definitions, conservative labeling was applied to default to the lower fear category (e.g., categorizing mild/moderate instances as mild). This methodology was adopted to minimize the risk of overestimating the relationship between fear and height perception.
To analyze the relationship between witness fear level and estimated sasquatch height, the fear level groups were converted to a numeric scale (Mild = 1, Moderate = 2, Elevated = 3, Extreme = 4).
Reported sasquatch heights were extracted verbatim from the witness report and recorded in decimal format. When ranges were provided (e.g., “7-8 feet tall”) the midpoint value (7.5 feet) was used. For reports relying on qualitative descriptors of height (e.g., “taller than my 6 foot tall fence”) the minimum value was used (6 feet). For this particular analysis, obtaining a precise height estimate for the sasquatch is not necessary since we are only interested in the general trend of the height estimates in relation to the witness’s fear level.
A Pearson correlation analysis was conducted to analyze the relationship between witness fear and estimated height using the scipy.stats.pearsonr function in Python, providing both the correlation coefficient (r) and p-value. A permutation test with 10,000 iterations was then implemented to test the null hypothesis that reported heights and witness fear level are independent. Fear level values were randomly shuffled while maintaining original height measurements, preserving marginal distributions and breaking potential association between variables. Using bootstrap resampling with 10,000 iterations, 95% confidence intervals were derived for the correlation coefficient (Efron & Tibshirani, 1994). Descriptive statistics (count, mean, standard deviation, minimum, and maximum) were calculated for reported sasquatch heights within each fear level category. An FDR correction was also applied.
Combined Probability Testing
To calculate the combined probability of all three patterns occurring simultaneously by chance, Fisher’s method was employed using the cycle-corrected lunar illumination p-value, and the FDR corrected p-values for both the seasonal and fear-height data. Using only corrected p-values allows for a more conservative probability estimate.
Results
Lunar Illumination Analysis
This analysis revealed three significant patterns within the sasquatch sighting reports. First, cycle-corrected moon illumination values during the reported sightings showed a non-random distribution (χ² = 8.717, 95% CI [2.398, 25.497], p = 0.0333).
Under a random distribution, the expected frequency was calculated to be 63.7 for the 0-25% and 75-100% groups, and 31.8 for the middle illumination values (25-50% and 50-75%). The raw count distribution (Figure 2A) exhibited a primary peak in the 75-100% range (n = 78, 1.23 times the expected frequency), and a notable secondary peak in the 0-25% range (n = 52, 0.82 times the expected frequency). While the 0-25% frequency was below the expected value, it was substantially higher than the middle illumination ranges (25-75%, n = 57 combined), indicating a nonlinear relationship. The middle ranges (25-75%) displayed lower frequencies (n = 57) than the extremes and the expected frequency under random distribution. However, additional nuance was uncovered when examining the cycle-corrected lunar illumination distribution.
The cycle-corrected data (Figure 2B) displayed two distinct groups within the data. The 75-100% group remained as the highest frequency group (1.23 times the expected frequency), and the 50-75% group also exceeded expectations (1.10 times the expected frequency). The 0-25% and 25-50% groups fell below expected frequencies (0.82 and 0.69 times expected, respectively).
Seasonal Distribution
Seasonal analysis displayed a highly significant non-random distribution (χ² = 21.426, 95% CI [9.043, 44.872], p < 1 × 10⁻4, FDR p < 1 × 10⁻3) . Under the null hypothesis, no seasonal variation would occur (25% per season). However, report frequency peaked during the fall (n = 68, 35.6%) and summer (n = 58, 30.4%), contrasting sharply with the spring (n = 29, 15.2%) and winter (n = 36, 18.8%) frequencies (Figure 3).
The bootstrap analysis confirmed the robustness of these findings. The permutation testing (p = 0.0002) further validated this seasonal preference, suggesting non-random occurrences.
Witness Fear versus Estimated Sasquatch Height
Analysis revealed a significant positive relationship (Figure 4, 5) between witness fear level and estimated sasquatch height (r = 0.219, 95% CI [0.063, 0.366], p = 0.0024, FDR p = 0.0033). Mean reported heights consistently increased as fear increased (Figure 4). Witnesses classified as “mild” consistently estimated lower heights but also the greatest variability (M = 6.8 ft, SD = 1.5), while those showing “moderate” fear reported intermediate heights (M = 7.4 ft, SD = 0.9). Reports where witnesses expressed “elevated” fear reported the tallest heights (M = 7.8 ft, SD = 0.9), and those with “extreme” fear reported similar but slightly smaller heights (M = 7.7 ft, SD = 0.9). The correlation coefficient (r = 0.219) indicates a modest relationship, but the significant p-value suggests it is still meaningful. Permutation testing with 10,000 iterations validated this relationship (p = 0.0022).
Combined Statistical Testing
Combined statistical analysis using Fisher’s method incorporated the cycle-corrected moon illumination p-value and FDR corrected permutation test p-values for seasonal distributions and witness fear correlation. This analysis indicated an extremely low probability of the observed patterns occurring by random chance (p < 1 × 10⁻4). The combined probability of random occurrence corresponds to an odds of 1:98,348.
Expanded Analysis with Full Dataset
To verify the results seen in the filtered dataset were not artifacts of sampling bias, an analysis of the full dataset was conducted with the basic filters in place (Class A sightings from the South and West regions; n = 697). This expanded analysis examined the same three variables (lunar illumination, season, and witness fear level versus height) without requiring complete data for all variables for each report. Each analysis was performed independently, using the maximum number of datapoints for each variable.
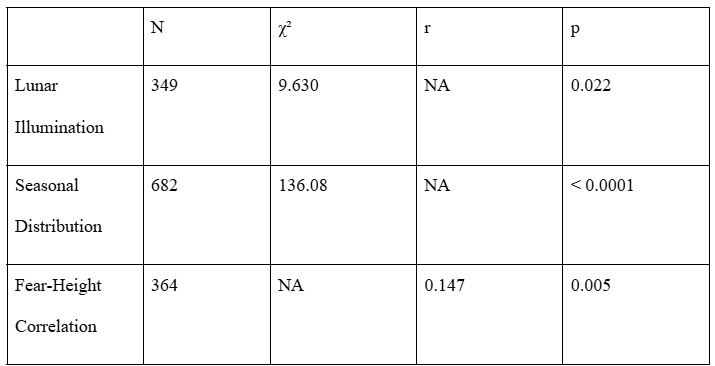
All three patterns observed in the filtered dataset (n = 191) remained significant in the expanded dataset. The raw lunar illumination data (n = 349; Figure S1) displayed a similar bimodal distribution to the filtered dataset with peaks exceeding the expected frequencies for both the 0-25% and 75-100% illumination groups. The cycle-corrected lunar illumination dataset (Figure S2) had a unimodal distribution with only the 75-100% illumination group exceeding the expected frequency (1.20 times the expected frequency), and significant chi-square test results (χ² = 9.63, p = 0.022). Reports occurring during near full-moon conditions (75-100% illumination) were 1.20 times more frequent than the expected value. Reports occurring in the other illumination groups occurred less frequently than expected.
The seasonal distribution (Figure S3) showed a stronger non-random pattern (χ² = 136.08, p < 0.0001) than the filtered dataset. Comparable to the filtered dataset, the summer (n = 253, 1.48 times expected) and fall (n = 240, 1.41 times expected) displayed dominance in sighting frequency over the spring (n = 92, 0.54 times expected) and winter (n = 97, 0.57 times expected).
The fear-height analysis (n=364; Figure S4 and S5) verified a positive relationship between witness fear level and estimated sasquatch height (r = 0.147, p = 0.0049). The correlation coefficient is slightly lower than the filtered dataset’s (r = 0.219), it is still statistically significant, and means increase from 7.2 ft in mild fear cases to 7.6 ft in extreme.
Table S1 summarizes the comparisons between the full and filtered datasets.
Discussion
Pattern Interpretation
This analysis revealed the combined probability the patterns observed in these sasquatch witness reports occurring by random chance is extremely low (p < 1 × 10⁻4). The complexity and consistency of these patterns suggests an alternative to random occurrence or independent hoaxing, especially given the vast temporal and geographic span of the reports. Each pattern potentially aligns with either documented biological, ecological, or psychological phenomenon, suggesting underlying reasons for their occurrences other than fabrication or random chance.
Lunar Illumination Patterns
The statistically significant increase in sightings during high moon illumination conditions (50-100%) versus the lower illumination periods (0-50%) suggests a distinct pattern rather than random occurrence, and deserves to be examined using multiple frameworks. To analyze this trend, three primary lenses are utilized: predator ecology, human activity patterns, and psychological phenomena.
From an ecological perspective, this preference for near-full moon illumination conditions regardless of time of day aligns with behaviors of documented large nocturnal predators (Prugh & Golden, 2013; Packer et al. 2011). Studies have shown that some nocturnal predator species, like black bears (Packer et al., 2011) and coyotes (Prugh & Golden, 2013), display heightened activity during near-full moon conditions. Near-full moon periods can provide increased visibility for nocturnal predators (Todd et al., 2015), influencing predator-prey interactions (Taylor et al., 2023). It has been documented that prey will decrease their activities (Kotler et al., 1991), in some cases from 40-70%, during near full moon conditions in an effort to avoid predation (Taylor et al., 2023), while predators will increase their activities during these times. Though assumptions cannot be made regarding potential sasquatch behavioral patterns, it is clear the frequency of reports, and significance in the uptick during elevated lunar illumination conditions, follows the patterns of other North American predators, leaving room for further analysis.
Increased human activity during full moon conditions has been a topic of study for decades (Packer et al. 2011; Casiraghi et al., 2021; Cajochen et al., 2013) and potentially could explain the increase in sighting reports during this time. Studies have shown animals that predate upon humans will adjust their hunting practices to increase the likelihood of a successful hunt. It has been found that lions in Africa will increase their hunting practices during full moon conditions due to an increase in human activities during these times (Packer et al., 2011). Studies have also shown humans typically sleep less during full moon conditions (Casiraghi et al., 2021; Cajochen et al., 2013), potentially extending the opportunity for outdoor activities. Additionally, contrary to popular belief, this increase in sighting encounters during near-full moon conditions is not likely to be related to increased visual acuity from the witness due to higher moon illumination. The illumination between a new and full moon only differs by one order of magnitude (0.03 to 0.26 lx, respectively), an insufficient amount to aid in human sight (Todd et al., 2015). Another humanistic explanation could be due to memory anchoring. Witnesses may recall events easier when immersed in particular environments (Godden & Baddeley, 1975; Smith & Vela, 2001). Potentially, the presence of a full or near-full moon could be distinctive enough to act as a memory cue, allowing the witness to more easily recall events of anomalous phenomena. Potentially, this could result in increased reports during periods of higher moon illumination.
The consistency and complexity of the lunar illumination pattern across reports spanning vast temporal and geographic frames suggests either a remarkable coincidence, intricate coordination of fabricated reports among witnesses, or signals of activity consistent with documented animal behaviors. The non-random pattern of the data, whether due to a biological entity or not, strongly warrants further study, and in itself provides a testable hypothesis for future research. Future studies could include time of day, weather, or witness activity during the encounter to dive into this variable more in-depth.
Seasonal Distribution
The highly significant non-random distribution of sasquatch sightings across seasons (χ² = 21.426, p < 0.0001) coincides with both ecological and humanistic explanations. Sighting reports peak in both the summer and fall and lulled during the spring and winter. This seasonal variation in report frequency can be analyzed through both ecological and human behavioral concepts.
The autumnal maximum of sighting reports aligns well with documented behavioral patterns of known large North American mammals. Bears, for instance, engage in hyperphagia during the fall in preparation for winter. Hyperphagia leads to significant increases in mobility and daily activities, including larger home ranges (Nelson et al., 1983; Noyce & Garshelis, 1998, Mori et al., 2024). During this period, black bears have been documented increasing their home ranges by 2-3 times (Garshelis & Pelton, 1981), therefore increasing the likelihood of encountering a human. Other large mammals, including moose and elk, have been observed to increase their activities during fall rutting season (Bowyer, 1981; Mysterud et al., 2001). Additionally, large mammals will modify their existing activity patterns and ranges based on food availability (Schwartz et al., 2010). Pre-winter preparations increase activity, leading to cyclical patterns across many North American mammals (Humphries et al., 2017; Sheriff et al., 2011).
From a humanistic perspective, this pattern could be the result of increased human presence in remote areas. Many North American hunting seasons occur in the fall, leading to increased human presence in remote areas (Larson et al., 2014). Potentially, hunters could misidentify other hunters in dark clothing as an anomalous animal. Also, the marked lack of foliage in the fall would allow humans to see up to 60% further into the forest (Kellner & Hubbell, 2017), expanding the opportunity to witness anomalous phenomena. Culturally, autumn is often associated with holidays such as Halloween, a holiday shrouded in supernatural and cryptid topics, which may prime the witnesses leading to possible misidentification or misinterpretation of the event (Wilson & French, 2014).
The secondary peak in the summer could be partially explained by increased human outdoor activity during warmer months (Reilly & Peiser, 2006; Garringa et al., 2021). Recreational outdoor activities, such as camping, hiking, and fishing, generally peak during the summer months (National Park Service, 2024). Increases in human activity could lead to more experiences with anomalous phenomena and potential animal encounters.
From an ecological perspective, many North American animals have been documented as increasing their activities and home ranges during the summer. Juvenile predator mammals in particular, like black bears and cougars, have been documented to leave their family units during the summer and increase their ranges (Schwartz & Franzmann, 1992; Thompson & Jenks, 2010). North American predators may also alter their migratory habits in relation to prey movement, often varying their activity and ranges in the summer (Nelson et al., 2012). Black bears, for instance, have been shown to maintain closer proximity to human residences during the summer while increasing their ranges for foraging (Merkle et al., 2013). Increased animal activity, especially when encroaching on human properties, could lead to increased sighting reports.
The decrease in reported spring sightings is noteworthy in that it contradicts what might be expected following the winter’s lack of resources. Spring typically exhibits a period of increased activity among large North American mammals as they recover from limited winter food availability (Noyce & Garshelis, 1998). The spring’s decline in sightings reported in this dataset warrants further investigation and suggests either distinct biological patterns different from known North American megafauna, or potential reporting biases.
The bootstrap analysis (10,000 iterations) confirmed the robustness of this seasonal analysis, and permutation testing (p = 0.0002) refuted the null hypothesis of a random seasonal distribution. These statistical values strengthen the conclusion that the patterns observed in this data represent a genuine signal rather than an artifact of sampling methodology.
Witness Fear versus Estimated Sasquatch Height
The analysis revealed a positive significant correlation between witness fear and estimated sasquatch height (r = 0.219, 95% CI [0.063, 0.366], p = 0.0024, FDR p = 0.0033), and can be explored using a variety of human psychological frameworks.
The consistency of standard deviations for the moderate through extreme fear groups (uniformly SD = 0.9) contrasts sharply with the mild fear group’s higher variability (SD = 1.5). This pattern potentially represents the effect fear has on perceptual processing and encoding. Witnesses perceiving events during low emotional arousal may rely on analytical processing more than those in a heightened emotional state, potentially leading to a wider variety of spatial size estimates (Balcetis & Dunning, 2010). Conversely, during times of heightened fear, the amygdala’s elevated activity may cause exaggerated, yet more consistent, height estimates (Phelps & LeDoux, 2005) potentially explaining this difference in standard deviation of heights as fear increases. Other factors such as distance to the subject, time of day, and viewing conditions could potentially influence this difference in estimates and warrant further investigation.
The clear progression of increasing average heights from the mild (M = 6.8 ft) to extreme (M = 7.7 ft) fear groups could reflect on a number of subtle psychological effects. If the observed relationship between witness fear and estimated sasquatch height are due to a biological entity, the patterns could suggest larger individual sasquatches elicit a greater fear response from witnesses. Or, the results could suggest witnesses are engaged in fear-induced size distortion, in which the witness perceives the frightening stimulus as larger than it is in reality (Steffanucci & Proffitt; Teachman et al., 2018) . Additionally, the elevated and extreme fear groups have the largest sum of reports (n = 126), potentially explained by the psychological phenomenon of an enhanced ability to recall an event when emotions are heightened (Sharot et al., 2005, Bort et al., 2024).
While the correlation coefficient of 0.219 suggests a low-to-moderate relationship between witness fear and estimated sasquatch height and cannot explain the majority of the variance seen in the data, this is to be expected when dealing with human psychological factors or biological entities.
These patterns are particularly striking, and could be explained using existing psychological frameworks if sasquatches exist as a biological species. Regardless, the significance of the data suggests these patterns are not the result of random or coordinated hoaxing, but of some other cause.
Combined Analysis
The combined probability of all three of these patterns emerging by chance (p < 1 x 10^-4; 1:98,348) suggests an underlying phenomenon within these reports that transcends random chance or uncoordinated hoaxing. This probability is approximately two orders of magnitude smaller than the conventional significance benchmarks of standard (p < 0.05; 1:20) and highly significant (p < 0.001; 1:1,000) thresholds. Comparing this value to significance levels of other disciplines, in biology, ecology, and wildlife studies, a significance level of p < 0.05 is standard, but there are cases where more stringent values of p < 0.01 have been advocated for (Nakagawa & Cuthill, 2007). Psychological fields also typically use the conventional p < 0.05 threshold; some have advocated for a more conservative p < 0.005 threshold in an effort to reduce replication concerns (Benjamin et al., 2018). In fields like particle physics, a significance level threshold of 5 sigma (p < 3 x 10⁻⁷) is required, and it is worth noting ours approaches 4 sigma. While our combined probability does not exceed that of particle physics, it is more than sufficient when compared to the biological, ecological, and psychological sciences and suggests a highly significant result.
The low probability achieved in this analysis lies in the significance of the variables on their own, and suggests achieving such a value would require an intricate coordination of hoaxed reports spanning over six decades and a large temporal area of 17 states. Additionally, it would require the creators of the fabrications to possess subtle knowledge of an array of disciplines, some details not even being known or discovered until after the encounters took place and were reported. Additionally, the patterns seen in this data are highly unlikely to have been randomly hoaxes and transcends random chance. Using a multivariate approach to this subject has shown deeper studies are warranted and further analysis should be conducted on the data as a whole rather than focusing on one single factor.
Expanded Analysis
The expanded analysis corroborated the findings from the filtered dataset. All three patterns from the key variables (lunar illumination, seasonality, and fear-height correlation) displayed statistical significance in the larger dataset, despite less stringent filtering requirements. This consistency across variables suggests the findings from the filtered dataset are robust, and not artifacts of the filtering methodology. The seasonal distribution showed an even stronger effect in the expanded dataset (χ² = 136.08 vs. χ² = 21.426), supporting the findings that sasquatch sighting reports exhibit significant seasonality. The relationship between witness fear and estimated sasquatch height persisted in the expanded dataset, though the effect was slightly smaller (r = 0.147 vs. r = 0.219). These results substantiate our findings from the filtered dataset and conclude that the patterns are not due to filtering bias from the variable and exhibit non-random distributions.
Limitations
The requirements for analyzed reports significantly reduced the sample size from the original 1495 reports to the 191 filtered reports. While enhancing the consistency of the analysis and providing structure for robust probability testing using Fisher’s method, it may introduce selection bias as reports containing all necessary information differ slightly from those with incomplete data. Factors outside of those mentioned here may be at play in influencing the results of this investigation like time of day, length of encounter, and witness activity.
By expanding this analysis to a larger sample of size of any Class A sighting reports from the South or West regions containing information for at least one variable of interest, we were able to corroborate the initial findings. Statistical significance remained for all three variables, showing even stronger trends for the seasonality of reports (χ² = 136.08 versus. χ² = 21.426), and slightly reduced effect size for the witness fear-height relationship (r = 0.147 versus r = 0.219). This highlights the trade-offs between data quality and quantity, again suggesting other variables should be considered when analyzing the data especially for the lunar illumination and witness fear-height investigations.
Additionally, limiting the analysis only to the South and West regions (17 states) may not represent continental trends, as it lessens the geographic spread of the report data. This geographic restriction may inadvertently introduce sampling bias through cultural factors, regional reporting techniques, or area-specific ecological conditions. Enforcing a geographic constraint for this analysis was imperative for strong statistical analysis, but it does hinder the ability to draw generalized conclusions for the entirety of North America.
Lastly, the databases themselves (BFRO & NAWAC) in which reports were collected contain selection biases pertaining to the investigations, categorizations, and classifications of the information within the reports. While each organization does employ standardized collection and reporting techniques, they rely on volunteers to conduct investigations. This introduces the possibility of selection bias in regard to the information that is either included or left out of the public write-up. The available data may not represent a random sampling of all sasquatch encounters. Additionally, witnesses who choose to report their encounter may inherently differ from those who wish to have their encounter remain undocumented.
Despite these limitations, the consistency of the patterns across both the expanded and filtered datasets, coupled with the extremely low probability the patterns occurred simultaneously by chance (1:98,348), suggests further investigation into these reports is greatly warranted.
Conclusion
This study provides the first comprehensive statistical analysis of patterns in sasquatch sighting reports, examining lunar, seasonal, and psychological factors across nearly 200 witness accounts. The results reveal highly improbable correlations that challenge oversimplified explanations of sasquatch sighting reports as either fabrications or misidentified wildlife. The observed patterns - lunar illumination distribution, seasonal preferences, and fear-height correlations - align with established biological, ecological, and psychological phenomena in ways that would require remarkable sophistication to hoax across decades of independent reports, and transcend the possibility of patterns arising from random occurrence.
The lunar illumination pattern, showing peaks during both full and new moon conditions, mirrors both documented behavior patterns of large North American predators and human activities. Seasonal distributions align with optimal foraging conditions and increased human outdoor activity. Perhaps most compelling is the correlation between witness fear levels and reported subject heights, which demonstrates predictable psychological patterns that would be particularly difficult to coordinate across independent hoaxes.
While these findings cannot confirm the existence of an unknown primate species in North America, they demonstrate that sasquatch sighting reports contain internal patterns worthy of serious scientific investigation. The probability against these patterns occurring by chance (1:98,348) suggests either an unprecedented level of sophisticated hoax coordination or the documentation of consistent underlying phenomena.
Future research should expand this analytical framework to examine additional variables, geographic regions, and temporal trends. This work demonstrates the value of applying rigorous statistical methods to cryptozoological data, potentially bridging the gap between anecdotal evidence and systematic scientific investigation. Whatever the ultimate explanation for the sasquatch phenomenon, these results indicate that witness reports contain complex, consistent patterns that warrant further study.
Tables and Figures
Figure 1
Flowchart of Data Filtering Process

Figure 2
Reports Frequency Distributions of Raw and Cycle-Corrected Lunar Illumination Percentages
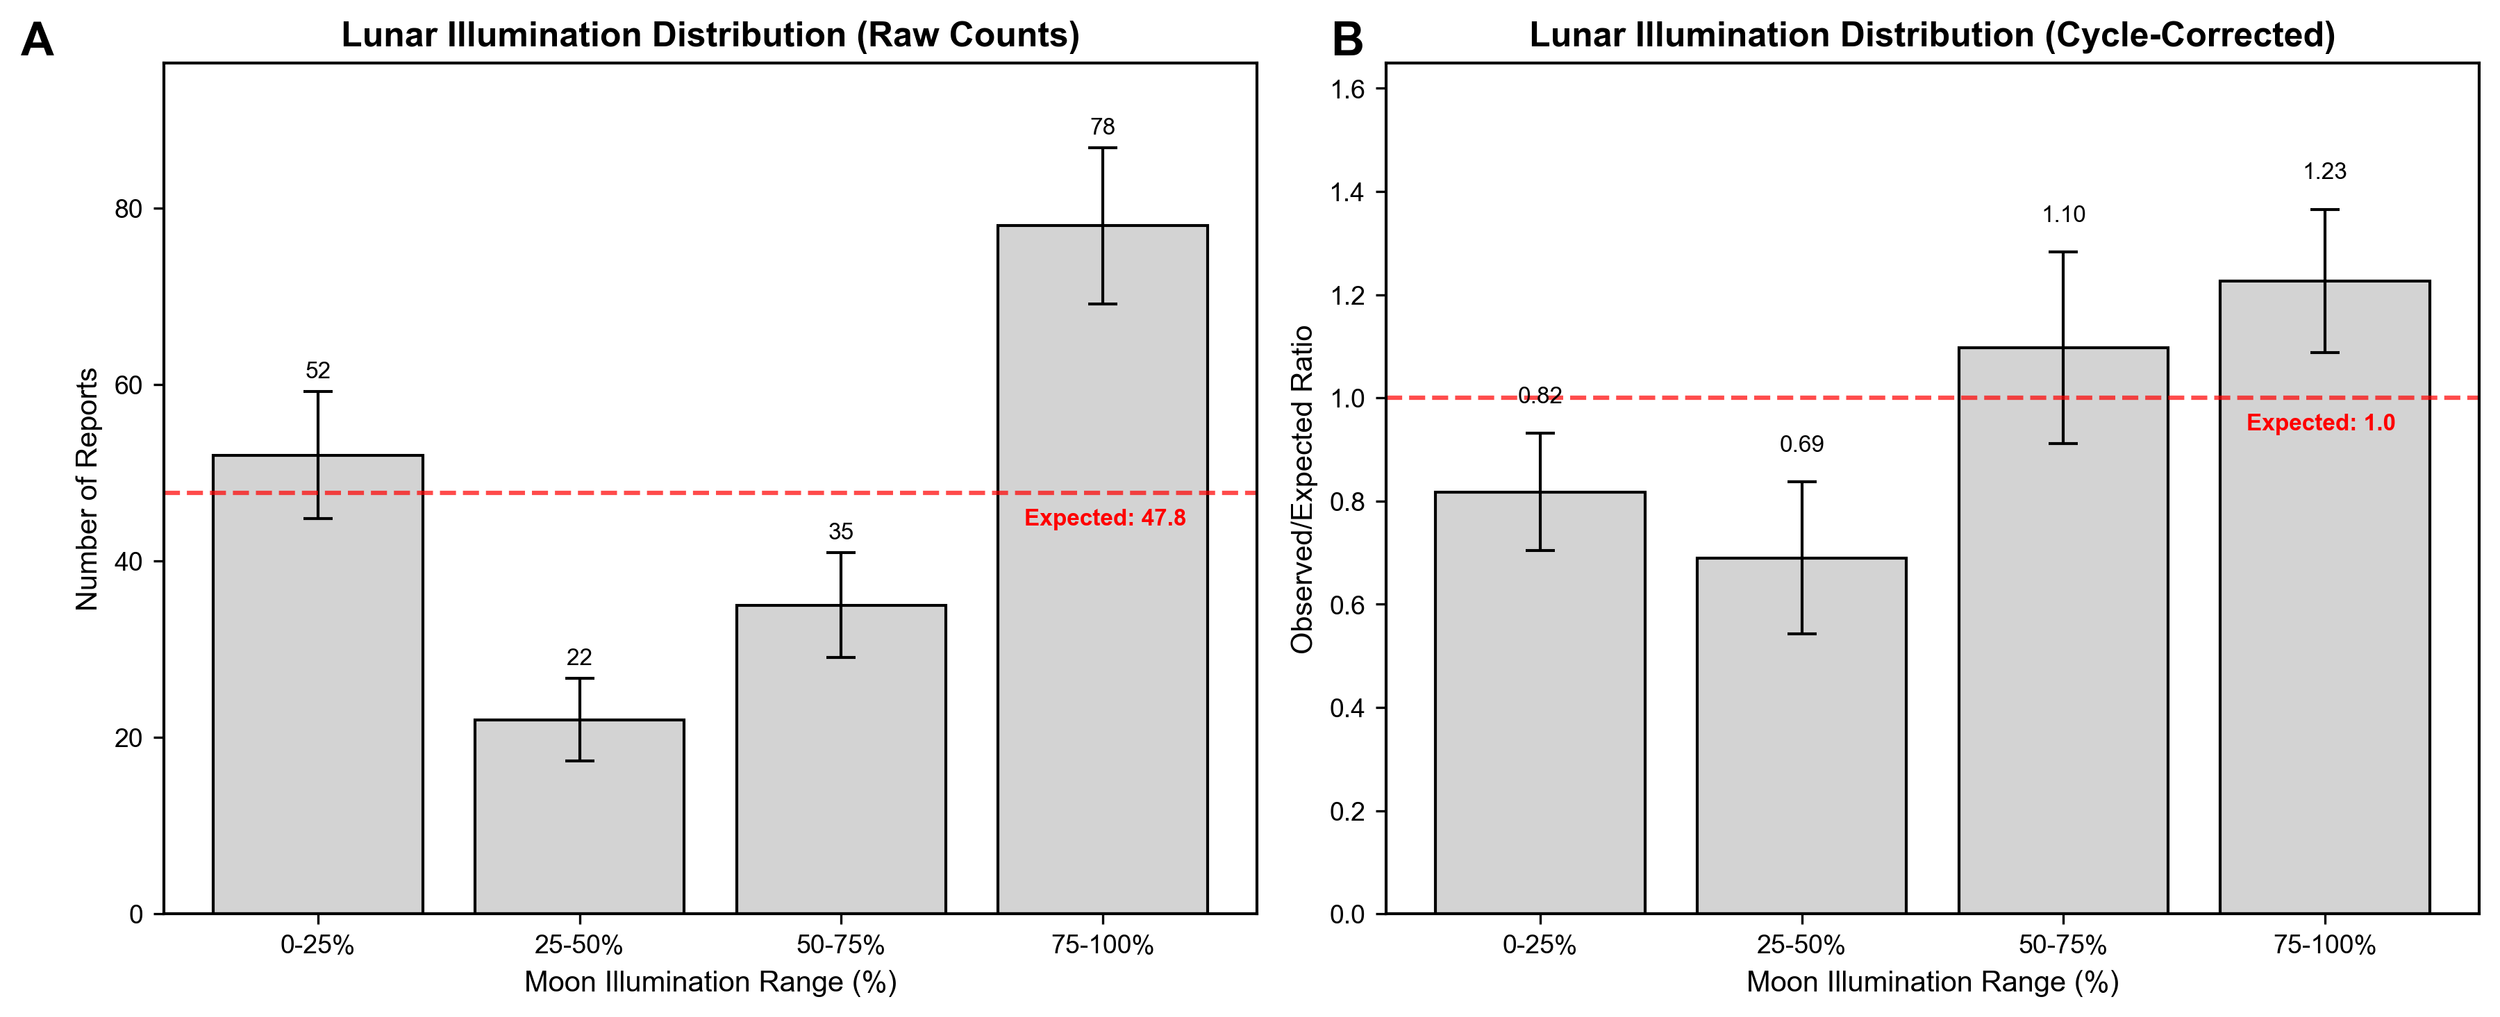
Figure 3
Seasonal Frequency Distributions of Filtered Reports
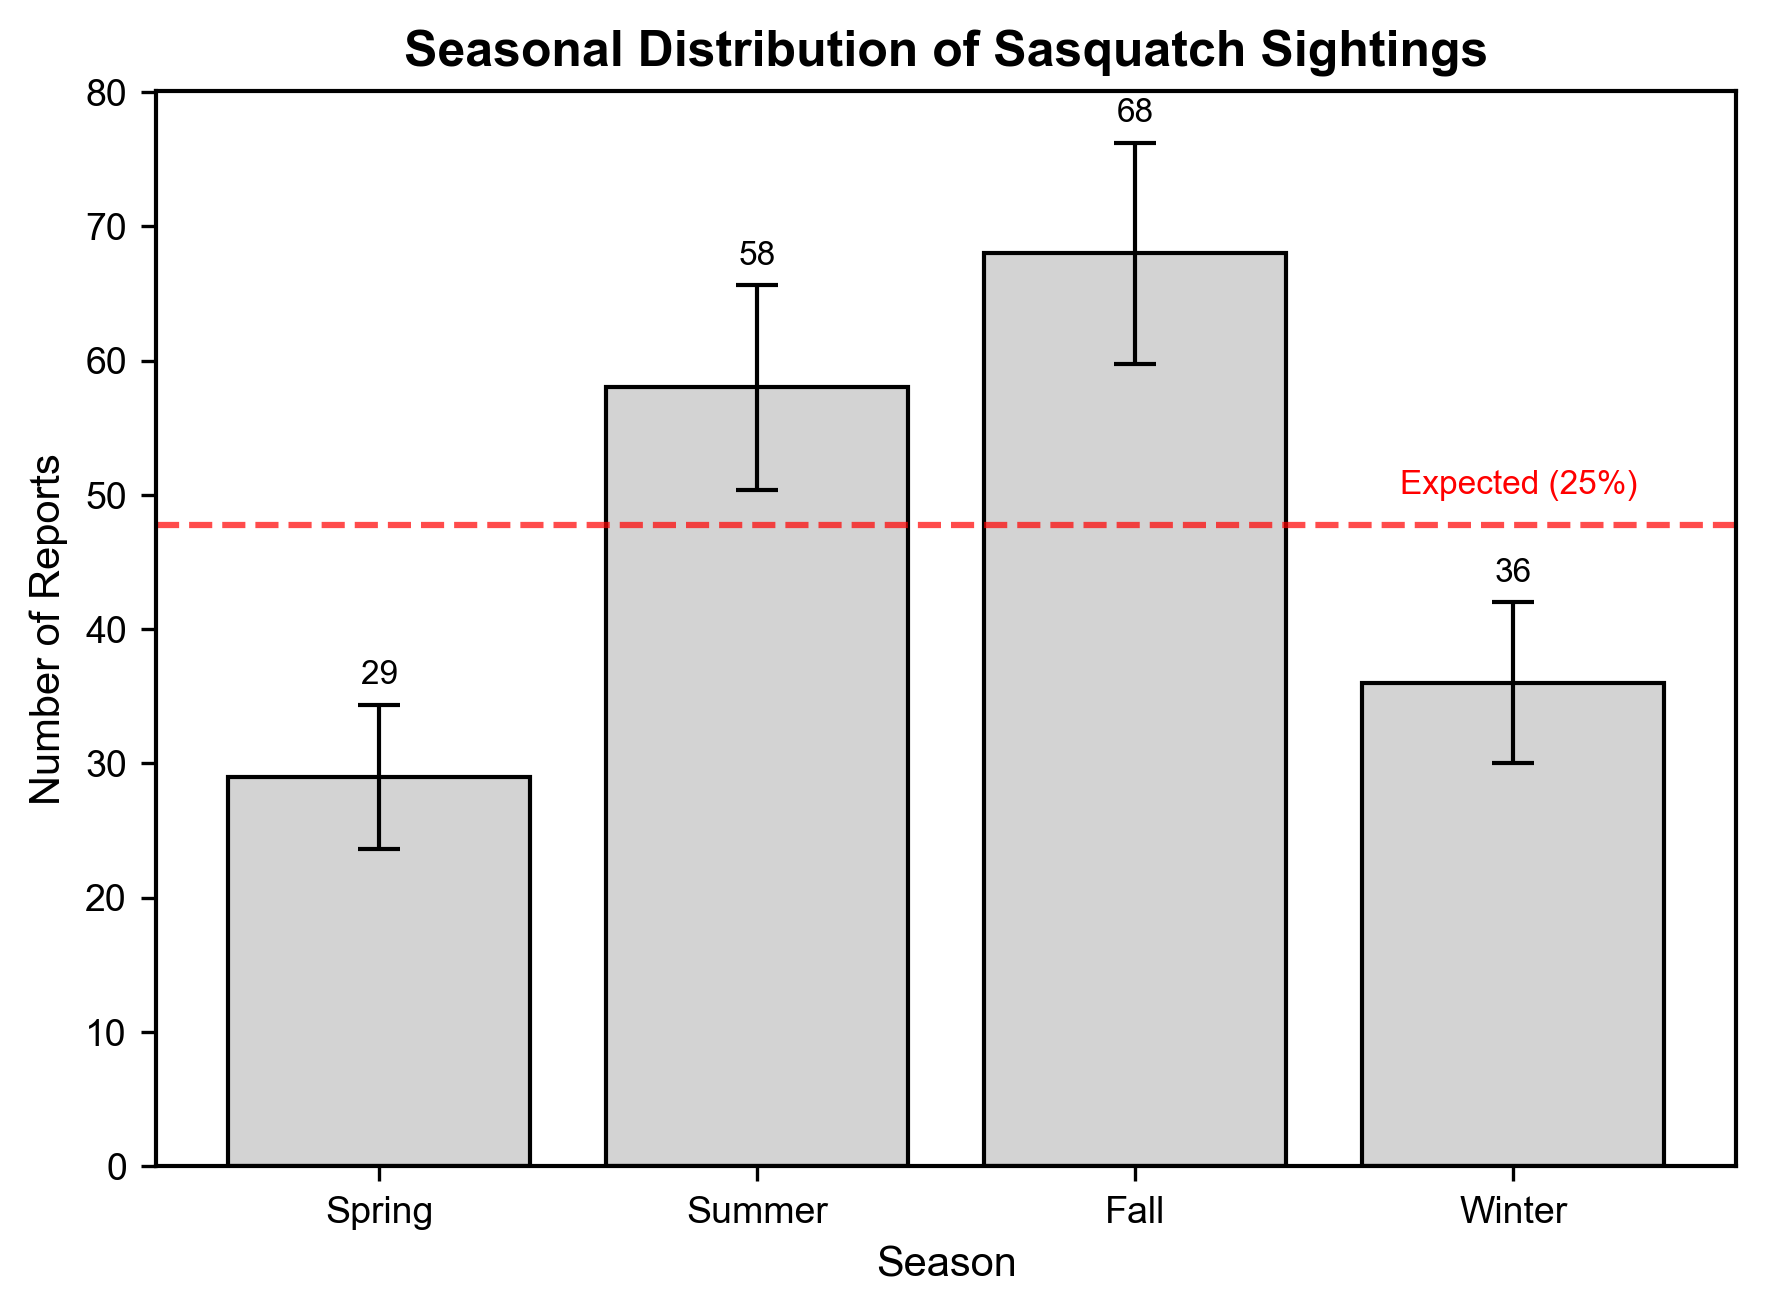
Figure 4
Witness Fear Level in Relation to Estimated Sasquatch Height

Figure 5
Correlation of Witness Fear Level and Estimated Sasquatch Height
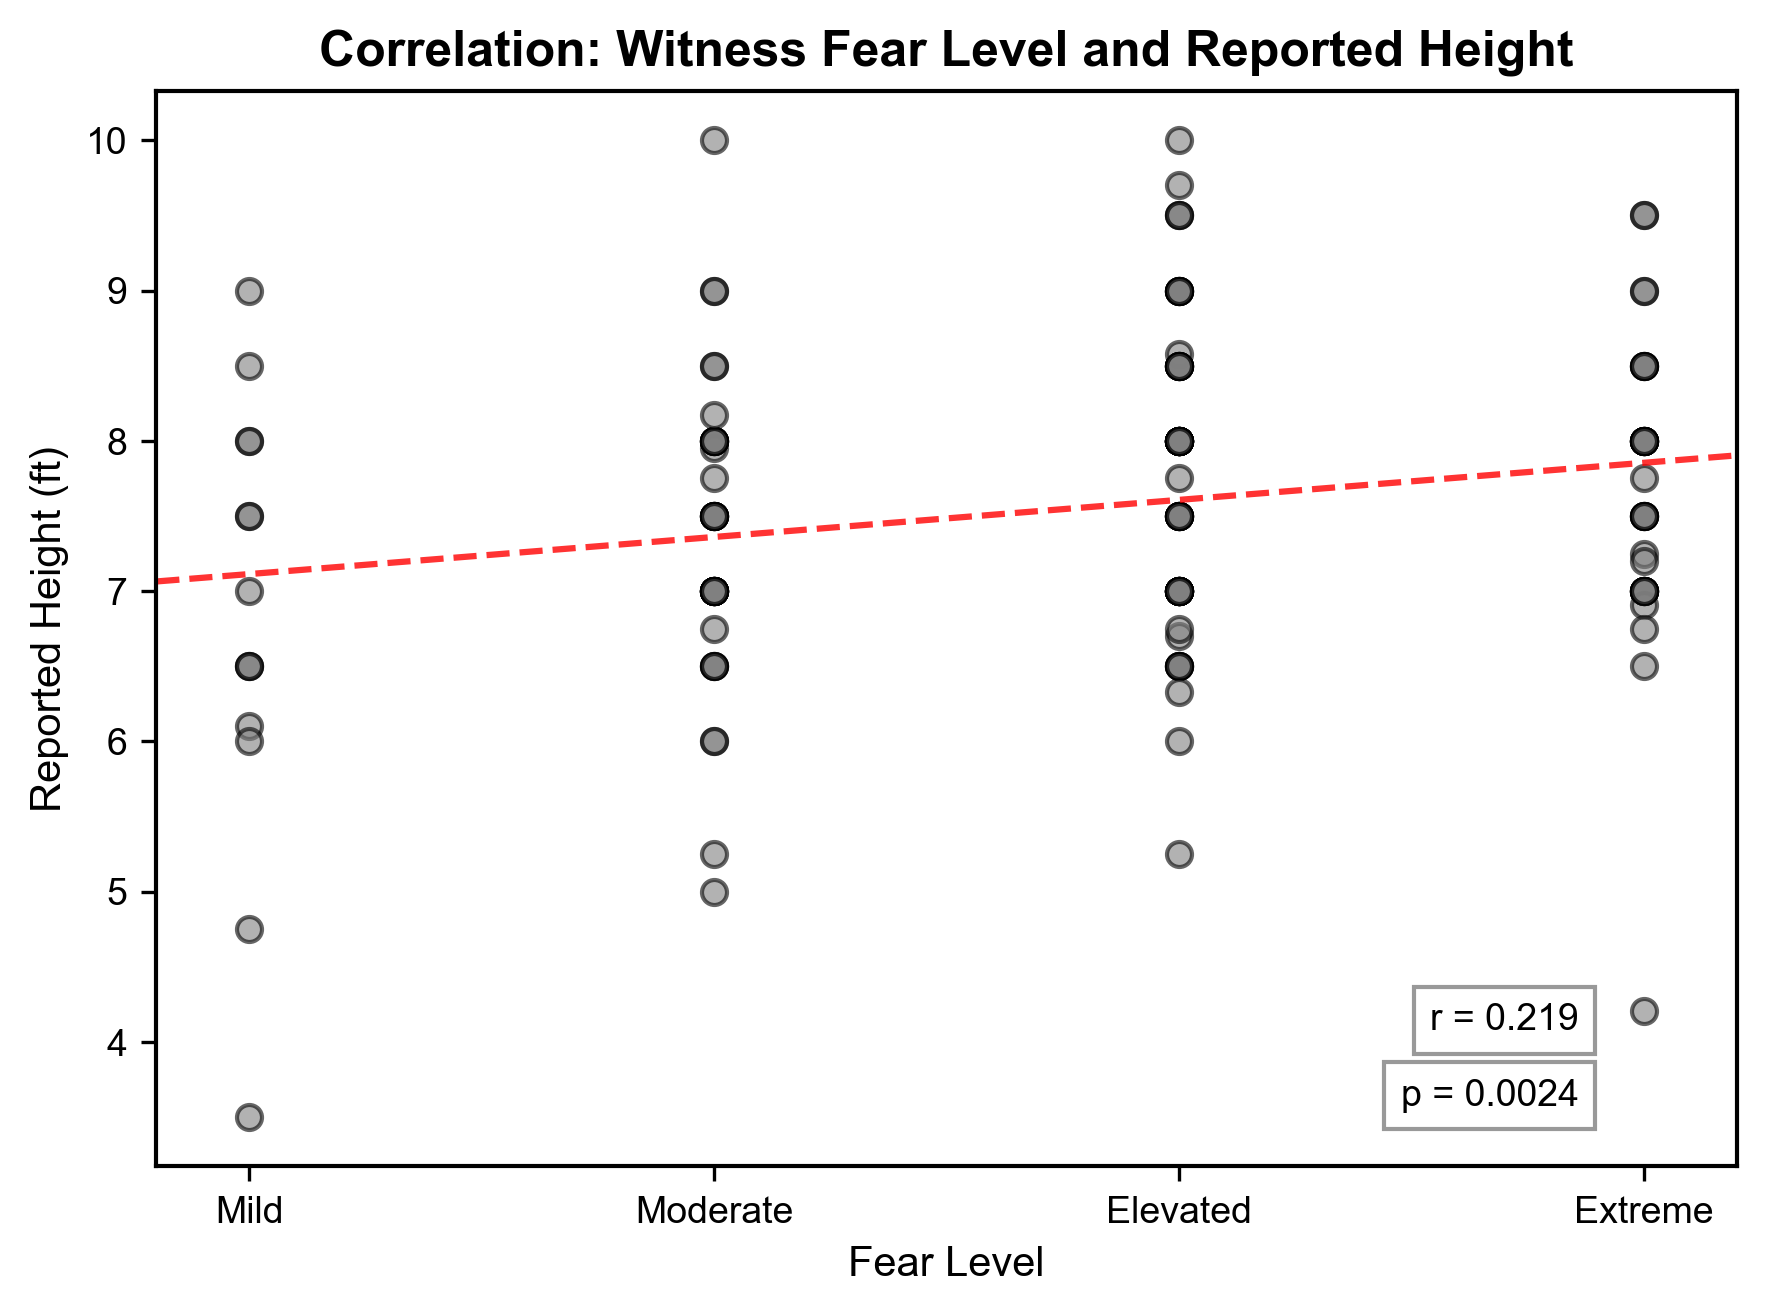
Table 1

Table 2

Table 3

Supplementary Information
The expanded dataset included Class A sighting reports from the South and West regions of the United States (n=697) from the BFRO and NAWAC databases. The expanded dataset uses the maximum number of available data points for each variable, unlike the filtered dataset that requires complete data for all variables in each report.
Figure S1
Raw moon illumination frequencies for Class A sightings in the South and West regions of the USA.

Figure S2
Cycle-corrected moon illumination ratios for Class A sightings in the South and West regions of the USA.

Figure S3
Seasonal sasquatch sighting distributions for Class A sightings from the South and West USA.

Figure S4
Estimated sasquatch heights grouped by witness fear level.

Figure S5
Estimated sasquatch heights grouped by witness fear level.

Table S1
Expanded dataset statistical analysis results
All statistical tests and significance thresholds were identical to those performed on the filtered dataset as described in the primary Methods section. The lunar illumination calculation, cycle-correction, and fear-level categorization followed the same procedures.
References
Balcetis, E., & Dunning, D. (2010). Wishful seeing: More desired objects are seen as closer. Psychological Science, 21(1), 147-152. https://doi.org/10.1177/0956797609356283
Benjamin, D. J., Berger, J. O., Johannesson, M., Nosek, B. A., Wagenmakers, E. J., Berk, R., Bollen, K. A., Brembs, B., Brown, L., Camerer, C., Cesarini, D., Chambers, C. D., Clyde,
M., Cook, T. D., De Boeck, P., Dienes, Z., Dreber, A., Easwaran, K., Efferson, C., Fehr,
E., ... Johnson, V. E. (2018). Redefine statistical significance. Nature Human Behaviour, 2(1), 6-10. https://doi.org/10.1038/s41562-017-0189-z
Bort, V. C., Katsumi, Y., Wirkner, J., Wendt, J., Hamm, A., Dolcos, F., & Weymar, M. (2024). Disentangling emotional source memory: A mega-analysis on the effects of emotion on item-context binding in episodic long-term memory. Frontiers in Psychology, 15. https://doi.org/10.3389/fpsyg.2024.1459617
Bowyer, R. T. (1981). Activity, movement, and distribution of Roosevelt elk during rut. Journal of Mammalogy, 62(3), 574-582. https://doi.org/10.2307/1380404
Cajochen, C., Altanay-Ekici, S., Münch, M., Frey, S., Knoblauch, V., & Wirz-Justice, A. (2013). Evidence that the lunar cycle influences human sleep. Current Biology, 23(15), 1485-1488. https://doi.org/10.1016/j.cub.2013.06.029
Casiraghi, L., Spiousas, I., Dunster, G. P., McGlothlen, K., Fernández-Duque, E., Valeggia, C., & de la Iglesia, H. O. (2021). Moonstruck sleep: Synchronization of human sleep with the moon cycle under field conditions. Science Advances, 7(5), Article eabe0465. https://doi.org/10.1126/sciadv.abe0465
Daegling, D. J. (2005). Bigfoot exposed: An anthropologist examines America's enduring legend. Choice Reviews Online, 42(10), 42-5947. https://doi.org/10.5860/choice.42-5947
Efron, B., & Tibshirani, R.J. (1994). An Introduction to the Bootstrap (1st ed.). Chapman and Hall/CRC. https://doi.org/10.1201/9780429246593
Garriga, A., Sempere-Rubio, N., Molina-Prados, M. J., & Faubel, R. (2021). Impact of seasonality on physical activity: A systematic review. International Journal of Environmental Research and Public Health, 19(1), Article 2. https://doi.org/10.3390/ijerph19010002
Merkle, J. A., Robinson, H. S., Krausman, P. R., & Alaback, P. (2013). Food availability and foraging near human developments by black bears. Journal of Mammalogy, 94(2), 378-385.
Kellner, J. R., & Hubbell, S. P. (2017). Adult mortality in a low‐density tree population using high‐resolution remote sensing. Ecology, 98(6), 1700-1709. https://doi.org/10.1002/ecy.1847
Kotler, B. P., Brown, J. S., & Hasson, O. (1991). Factors affecting gerbil foraging behavior and rates of owl predation. Ecology, 72(6), 2249-2260. https://doi.org/10.2307/1941575
Krantz, G. S. (1992). Big footprints: A scientific inquiry into the reality of sasquatch. Johnson Books.
Larson, L., Stedman, R., Siemer, W., & Baumer, M. (2014). Exploring the social habitat for hunting: Toward a comprehensive framework for understanding hunter recruitment and retention. Human Dimensions of Wildlife, 19(2), 105-122. https://doi.org/10.1080/10871209.2014.850126
Meldrum, D. J. (2007). Ichnotaxonomy of giant hominoid tracks in North America. In S. G. Lucas, J. A. Spielmann, & M. G. Lockley (Eds.), Cenozoic tracks and traces: New Mexico Museum of Natural History & Science Bulletin (pp. 225-231).
Meeus, J. (1998). Astronomical algorithms (2nd ed.). Willmann-Bell.
Mori, T., Mori, S., & Izumiyama, S. (2024). Temporal and individual variation in the feeding habits of Asiatic black bears (Ursus thibetanus). Ecology and Evolution, 14. https://doi.org/10.1002/ece3.11562
National Park Service. (2024, October 17). VUStats dashboard - Social science.
https://www.nps.gov/subjects/socialscience/visitor-use-statistics-dashboard.htm
Nakagawa, S., & Cuthill, I. C. (2007). Effect size, confidence interval and statistical significance: A practical guide for biologists. Biological Reviews of the Cambridge Philosophical Society, 82(4), 591-605. https://doi.org/10.1111/j.1469-185X.2007.00027.x
Nelson, R., Folk, G., Pfeiffer, E., Craighead, J. J., Jonkel, C. J., & Steiger, D. L. (1983). Behavior, biochemistry, and hibernation in black, grizzly, and polar bears. Ursus, 5, 284-290.
Nelson, A. A., Kauffman, M. J., Middleton, A. D., Jimenez, M. D., McWhirter, D. E., & Barber, J. (2012). Elk migration patterns and human activity influence wolf habitat use in the Greater Yellowstone Ecosystem. Ecological Applications, 22(8), 2293-2307.
Noyce, K., & Garshelis, D. (1998). Spring weight changes in black bears in north central Minnesota: The negative foraging period revisited. Ursus, 10, 521-531.
Packer, C., Swanson, A., Ikanda, D., & Kushnir, H. (2011). Fear of darkness, the full moon and the nocturnal ecology of African lions. PLoS ONE, 6(7), Article e22285. https://doi.org/10.1371/journal.pone.0022285
Patterson, B. R., & Messier, F. (2001). Social organization and space use of coyotes in eastern Canada relative to prey distribution and abundance. Journal of Mammalogy, 82(2), 463-477. https://doi.org/10.1644/1545-1542(2001)082
Phelps, E. A., & LeDoux, J. E. (2005). Contributions of the amygdala to emotion processing: From animal models to human behavior. Neuron, 48(2), 175-187. https://doi.org/10.1016/j.neuron.2005.09.025
Prugh, L. R., & Golden, C. D. (2014). Does moonlight increase predation risk? Meta-analysis reveals divergent responses of nocturnal mammals to lunar cycles. Journal of Animal Ecology, 83(2), 504-514. https://doi.org/10.1111/1365-2656.12148
Reilly, T., & Peiser, B. (2006). Seasonal variations in health-related human physical activity. Sports Medicine, 36(6), 473-485. https://doi.org/10.2165/00007256-200636060-00002
Sharot, T., Delgado, M. R., & Phelps, E. A. (2004). How emotion enhances the feeling of remembering. Nature Neuroscience, 7(12), 1376-1380. https://doi.org/10.1038/nn1353
Schwartz, C. C., & Franzmann, A. W. (1992). Dispersal and survival of subadult black bears from the Kenai Peninsula, Alaska. The Journal of Wildlife Management, 56(3), 426-431.
Taylor, P., Swan, M., Sitters, H., Langdon, A., Pinkiewicz, T., & Stringer, D. (2023). Small mammals reduce activity during high moon illumination under risk of predation by introduced predators. Scientific Reports, 13, Article 10532. https://doi.org/10.1038/s41598-023-37166-1
Thompson, D. J., & Jenks, J. A. (2010). Dispersal movements of subadult cougars from the Black Hills: The notions of range expansion and recolonization. Ecosphere, 1(4), 1-11.
Todd, J., Barakat, B., Tavassoli, A., & Krauss, D. (2015). The moon's contribution to nighttime illuminance in different environments. Proceedings of the Human Factors and Ergonomics Society Annual Meeting, 59(1), 1056-1060. https://doi.org/10.1177/1541931215591297
Wilson, K., & French, C. C. (2014). Magic and memory: Using conjuring to explore the effects of suggestion, social influence, and paranormal belief on eyewitness testimony for an ostensibly paranormal event. Frontiers in Psychology, 5, Article 1289. https://doi.org/10.3389/fpsyg.2014.01289